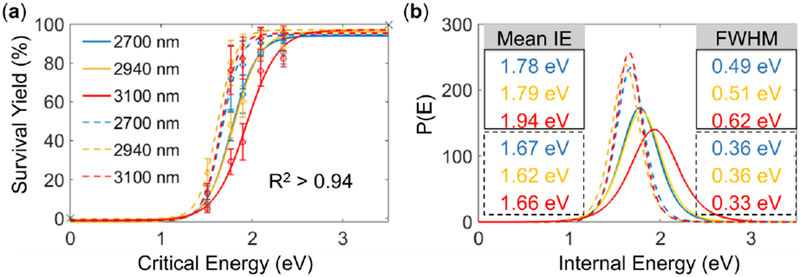
Figure 5.

(a) Sigmoidal curves and (b) IE distributions for IR-MALDESI analysis either with (solid lines) or without the ice matrix (dashed lines) at IS-CID of 20 eV. The mean IE and FWHM values for IR-MALDESI with and without the ice matrix are solid- and dashed-outlined, respectively.
