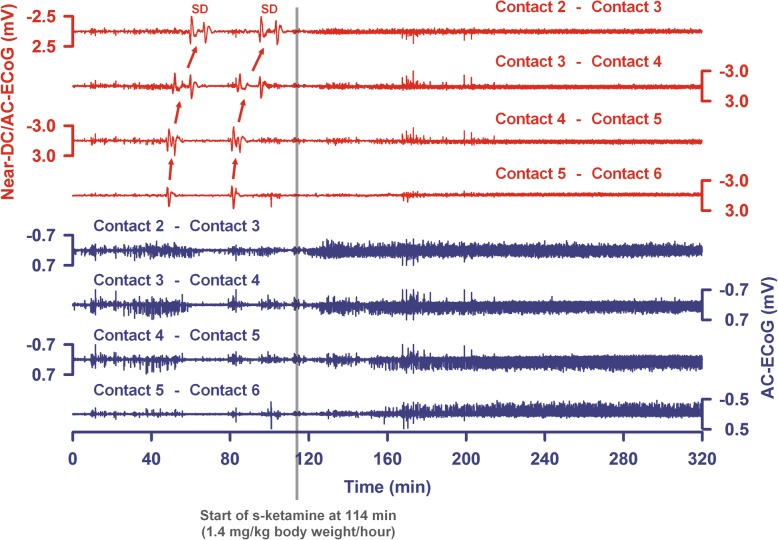
Fig. 2.
The last two SDs of a cluster are shown from a patient with aSAH, intraventricular, and intracerebral hemorrhage. Top traces show bipolar near-direct current (DC)/alternate current (AC) (frequency band 0.01–45 Hz) recordings from five electrode contacts and bottom traces show high-frequency spontaneous activity from the same electrode contacts (AC, frequency band 0.5–45 Hz). The arrows indicate the spread of the SDs between the electrode contacts. SDs no longer occurred after the intravenous administration of s-ketamine was started. Note that the spontaneous activity then recovered in all channels. The recovery is less pronounced in trace 8

