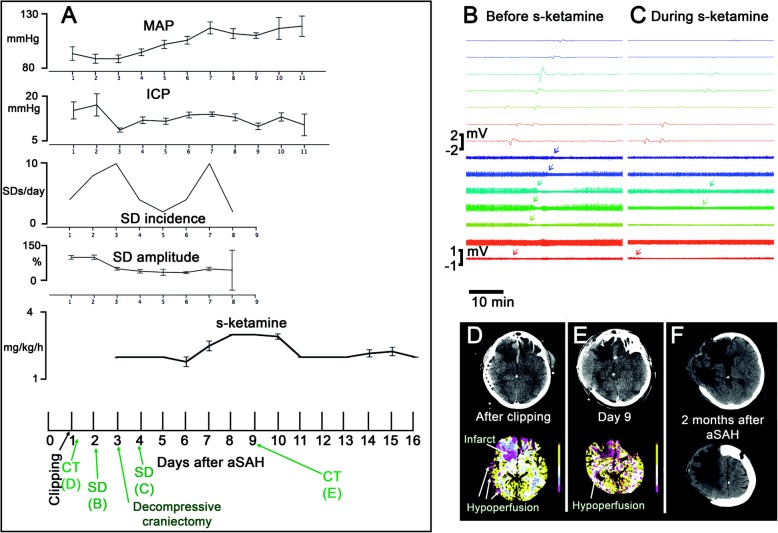
Fig. 3.
A 55-year-old female with WFNS 4 and modified Fisher grade 4 aSAH [36] due to rupture of an anterior communicating artery aneurysm is presented. On day 1 after the initial hemorrhage, the aneurysm was clipped, extraventricular drainage established, and a subdural electrode strip implanted. From the beginning, the patient showed increased ICP. On day 2, she developed pneumonia. S-ketamine started on day 2.5. On day 3, decompressive hemicraniectomy was performed to control the increased ICP. a The plots show MAP, ICP, the incidence of SDs, the amplitudes of the SDs’ near-DC-shifts, and the administered doses of s-ketamine over time. Error bars represent 95% confidence intervals. Note that the ECoG was recorded from day 1 to day 8. On the time axis of the lowest plot, the time points of the CT scans, and ECoG examples shown in b–f are indicated in green color. Note that s-ketamine was not sufficient to block the SDs in this case and the incidence of SDs even increased on day 7 despite continued application of s-ketamine. Further dose escalation on day 8 was then associated with another decrease in SD incidence before the electrode strip was removed. b SD propagating from electrode contact 8 to 1 before application of s-ketamine. Top traces show monopolar near-direct current (DC)/alternate current (AC) (frequency band 0.01–45 Hz) recordings from eight electrode contacts and bottom traces show high-frequency spontaneous activity from the same electrode contacts (AC, frequency band 0.5–45 Hz). The arrows in the bottom traces mark the start of the SD-induced depression periods. c During s-ketamine application, SDs typically propagated from electrode contact 8 to 2. Note that the SD amplitudes are smaller and that the spontaneous activity is now more suppressed than before s-ketamine administration. Accordingly, it is more difficult to see the SD-induced depression periods (arrows in the bottom traces). The smaller amplitudes of SDs and spontaneous activity not necessarily resulted from s-ketamine. It is in fact more likely that they were due to progressive metabolic compromise of the tissue [10]. This would also explain why s-ketamine was insufficient to block all SDs in this case. d The CT control post clipping showed infarcts in the right anterior cerebral artery (ACA) territory (frontal base until the head of the caudate nucleus). The CT perfusion maps for cerebral blood flow, cerebral blood volume, mean transit time (MTT), and time to peak revealed hypoperfusion in the right ACA and middle cerebral artery (MCA) territories. As an example, the MTT is shown. e On day 9, the patient underwent a control CT after withdrawal of the electrode strip. The CT scan showed the hemicraniectomy and revealed enlargement of the right ACA infarct as well as progressive brain edema with gyral swelling suggesting additional right MCA infarction. f Right-sided ACA and MCA infarcts in the late CT control scan 2 months after aSAH

