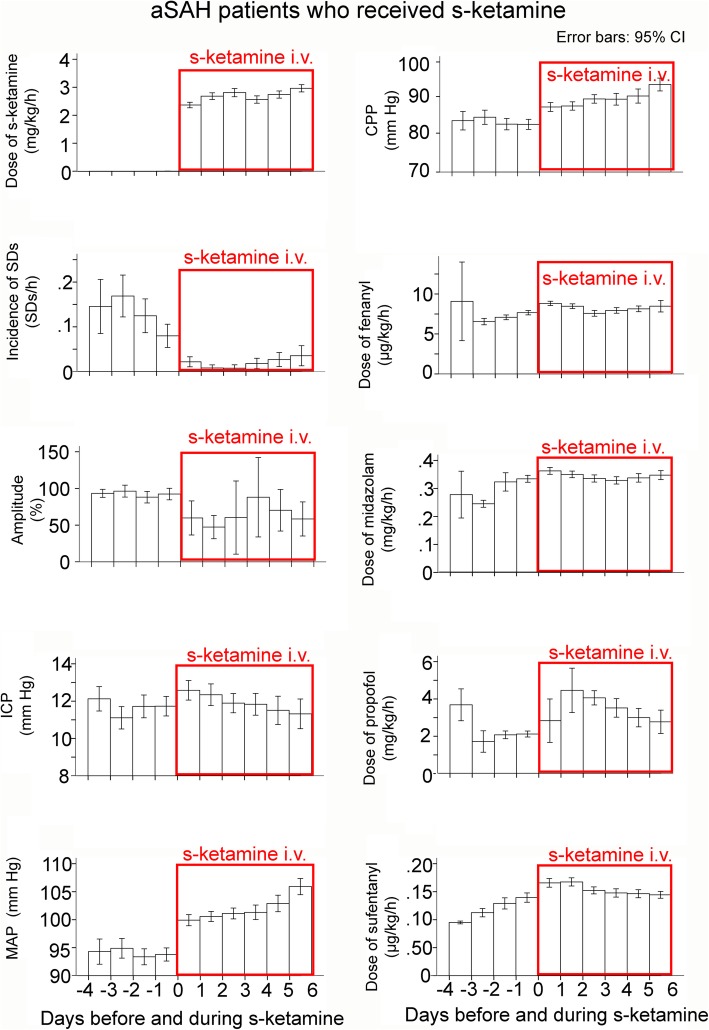
Fig. 6.
Data classified as a function of the time point when s-ketamine was applied. The means are presented here with 95% confidence interval (CI). When s-ketamine was discontinued, subsequently recorded data was not used for this analysis. Note that (i) the mean dose of s-ketamine was above 2 mg/kg BW/h and (ii) all variables analyzed showed a difference before and after s-ketamine. The incidence of SDs showed a clear and lasting reduction in response to s-ketamine

