Fig. 2.
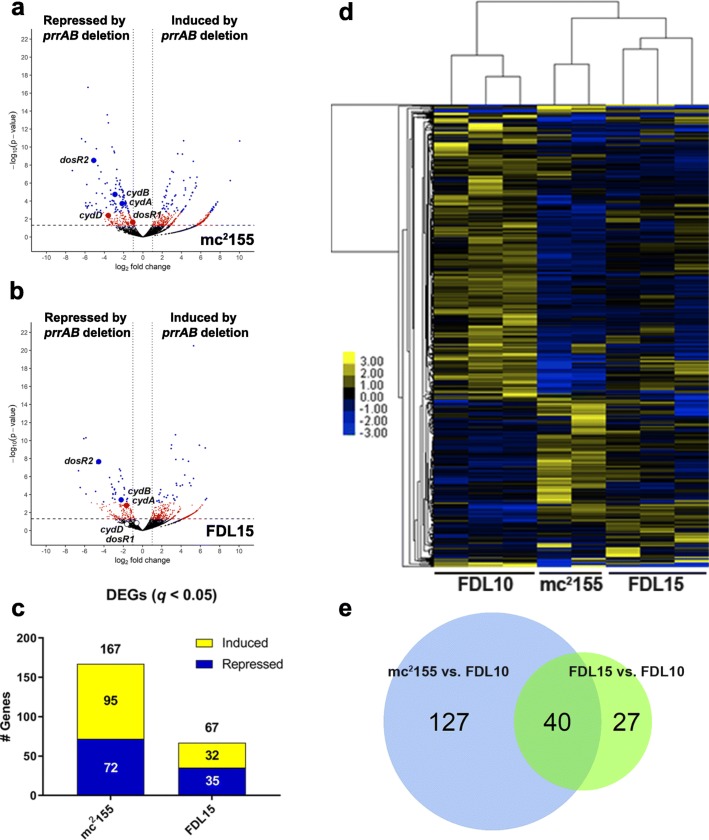
Global DEG profiles (q < 0.05) between the mc2 155 vs. FDL10 and FDL15 vs. FDL10 RNA-seq comparisons. Volcano plots of (a) FDL10 vs. mc2 155 and (b) FDL10 vs. FDL15 group comparisons with red and blue dots representing differentially-expressed genes with p < 0.05 and q < 0.05, respectively. The horizontal hatched line indicates p = 0.05 threshold, while the left and right vertical dotted lines indicate log2 fold change of − 1 and + 1, respectively. c Repressed (blue) and induced (yellow) DEGs (q < 0.05) in mc2 155 (WT) and FDL15 (prrAB complementation strain) compared to the FDL10 ΔprrAB mutant. d Average hierarchical clustering (FPKM + 1) of individual RNA-seq sample replicates. e Venn diagrams indicating 40 overlapping DEGs (q < 0.05) between mc2 155 vs. FDL10 (WT vs. ΔprrAB mutant) and FDL15 vs. FDL10 (prrAB complementation strain vs. ΔprrAB mutant) strain comparisons

