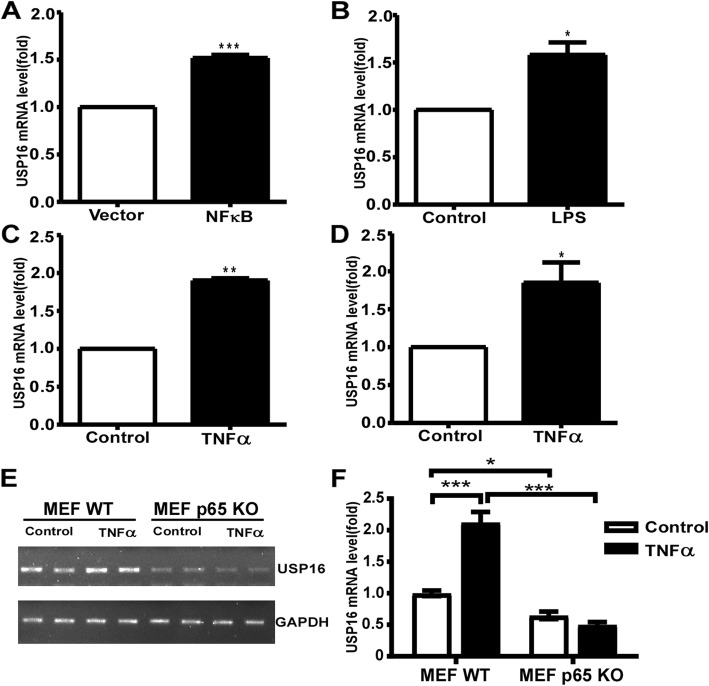
Fig. 5.
Enhancement of USP16 transcription in response to p65, LPS and TNFα. (a) HEK293 Cells were transfected with either empty vector (pMTF) or the p65 expression plasmids (pMTF-p65) for 24 h, and USP16 mRNA levels were determined by qRT-PCR. (b) SH-SY5Y cells were exposed to LPS at 50 ng/ml for 24 h. Total RNA was extracted. The mRNA levels of USP16 were determined by qRT-PCR and normalized against the levels of GAPDH. HEK293 cells (c) and SH-SY5Y cells (d) were exposed to TNFα at 10 ng/ml for 24 h. The mRNA levels of endogenous USP16 gene were determined by qRT-PCR and normalized against the levels of GAPDH. All data are presented as mean ± SEM. n = 3, *p < 0.01, by analysis of variance with Student’s t-test. MEF WT and p65 KO cells (e) were exposed to TNFα at 5 ng/ml for 24 h, and mRNA levels of USP16 and GAPDH were examined by RT-PCR. (f) The endogenous mRNA levels of USP16 were normalized against the levels of GAPDH and analyzed by two-way ANOVA test followed by post-hoc Turkey’s test. The values represent means ± SEM. n = 3, ***p < 0.001

