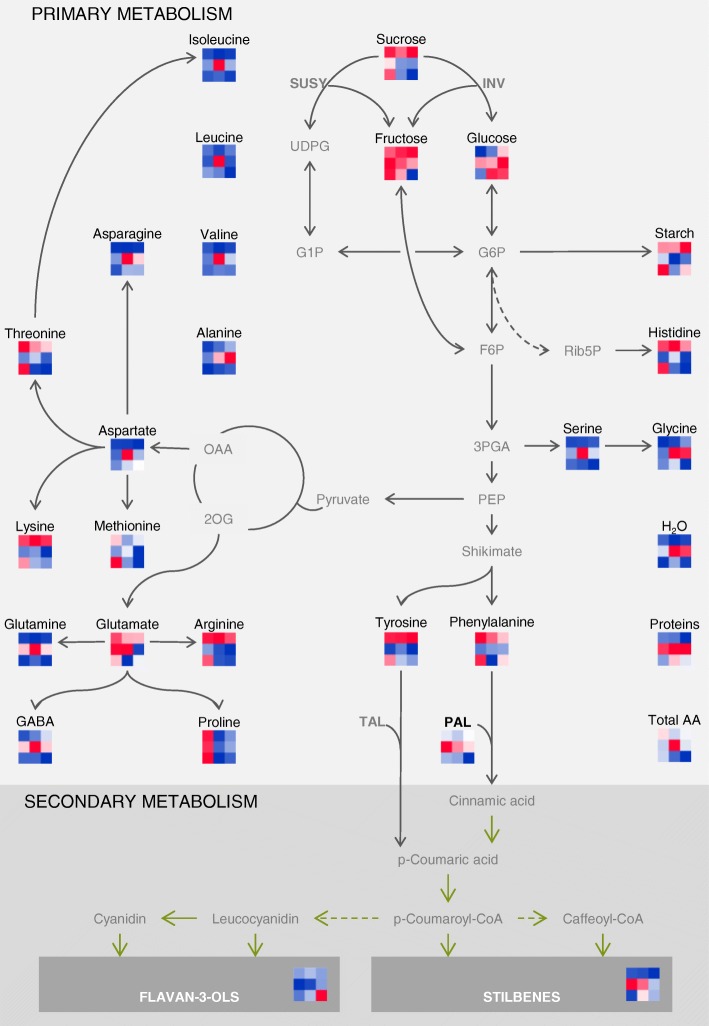
Fig. 1.
Simplified representation of primary and secondary metabolism showing heat maps of mean metabolite contents and enzymatic activities 28 d after grafting; red or blue indicate higher or lower metabolite content or enzymatic activity respectively. The first column shows the data from Vitis vinifera cv. Cabernet Sauvignon homo-grafts (CS/CS), the second and third columns show the data from CS grafted with the rootstocks V. riparia cv. Gloire de Montpellier and the V. berlandieri x V. rupestris hybrid cv. 1103 Paulsen respectively The first, second and third rows show the data from the scion, graft interface and rootstock respectively

