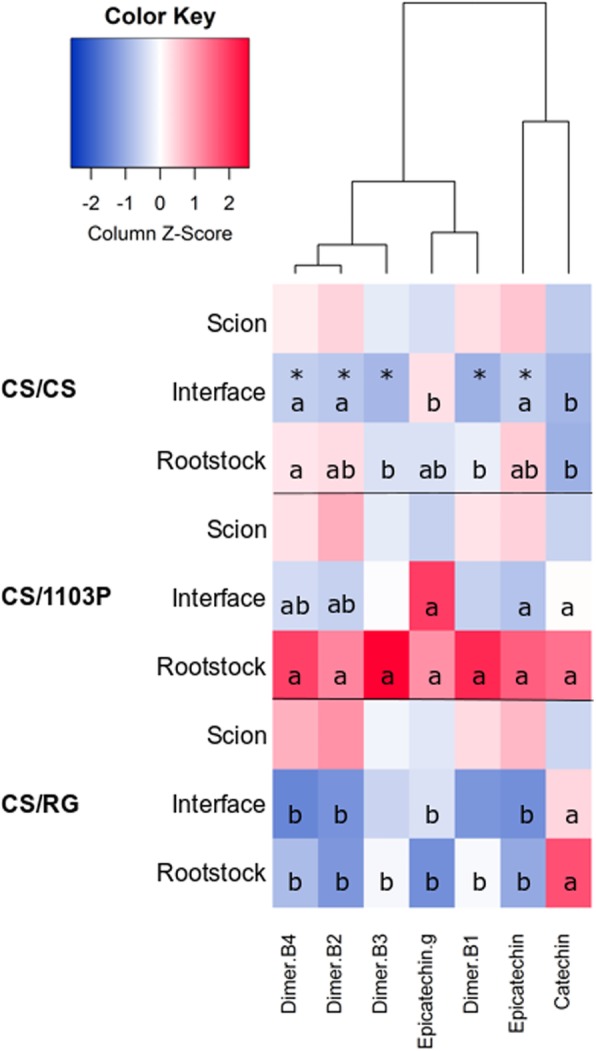
Fig. 2.

Heatmap of the mean concentration of flavanols in the scion, rootstock and graft interface tissues of Vitis vinifera cv. Cabernet Sauvignon homo-grafts (CS/CS) and CS grafted with the rootstocks V. riparia cv. Gloire de Montpellier (CS/RG) and the V. berlandieri x V. rupestris hybrid cv. 1103 Paulsen (CS/1103P) 28 d after grafting. Stars indicate the significant differences between the graft interface and scion and/or rootstock tissues of CS/CS (at the 5% level with either a one way ANOVA or Kruskal-Wallis test, Additional file 4: Table S4). The letters in the graft interface and rootstock data indicate the Tukey results of one way ANOVA or Kruskal-Wallis tests of flavanol concentration in the interface and rootstock (tested separately, Additional file 5: Table S5 and Additional file 6: Table S6 respectively)
