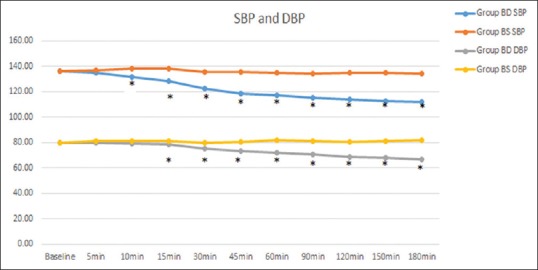
Figure 3.

Mean systolic and diastolic arterial pressures for the Groups BS (bupivacaine + saline) and BD (bupivacaine + dexmedetomidine). Asterisks indicate the time points of a statistically significant difference (P < 0.05) when the groups were compared
