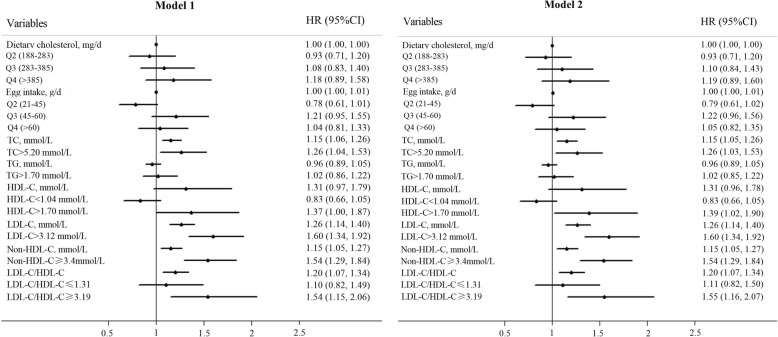
Fig. 2.
Forest plot for Cox proportional hazards model1 and model 2. HR: hazards ratio; CI: confidence interval. Model 1 was adjusted for sex, age, education years, BMI, smoking and drinking status, diabetes, hypertension and coronary artery disease history and per se use of lipid-lowering medication and intakes of energy, protein, carbohydrates, fat, SFA, PUFA, and MUFA. Model 2 was adjusted as for model 1 and for number of APOE ε4 alleles

