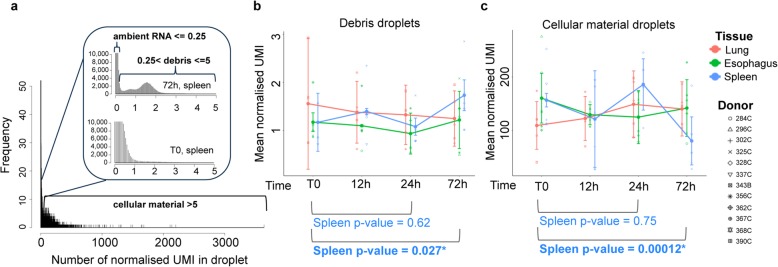
Fig. 3.
Loss of data quality is associated with increased “ambient RNA” and “debris” reads in the data. a Average spread of normalized UMI counts per droplet in the spleen, which were classified into ambient RNA, debris, and cellular material. b Mean values of normalized UMI in droplets containing debris or c cellular material. Individual sample means are shown for each donor with corresponding shape; color represents tissue. Means across donors per time point are shown by filled circles; whiskers represent standard deviation. p values were gained by Student’s paired (T0 vs 72 h) and non-paired (T0 vs 24 h) t test

