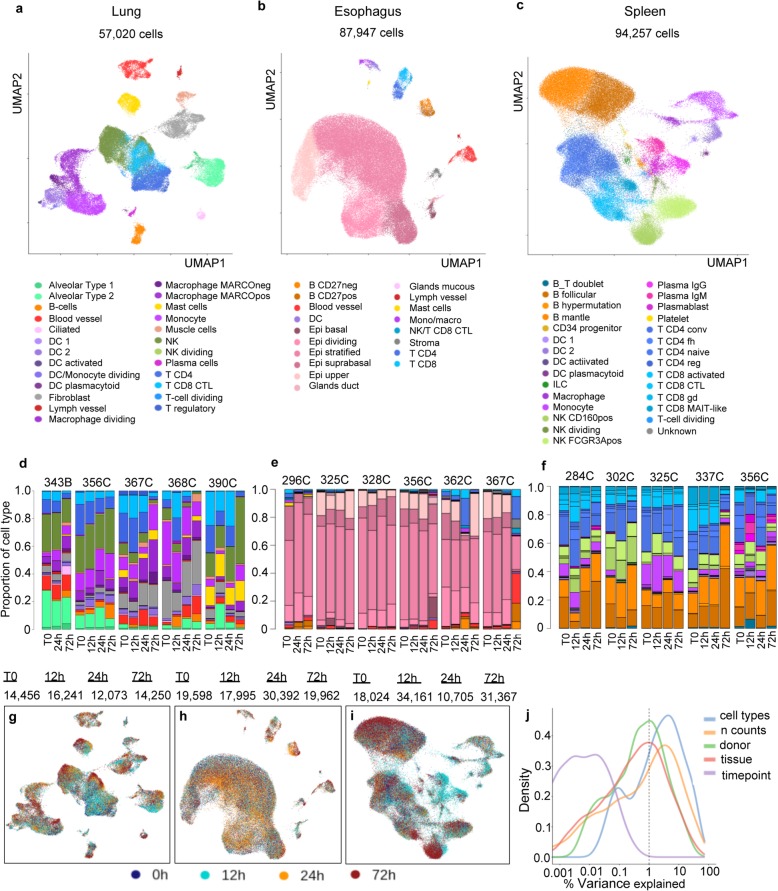
Fig. 4.
Cell types identified in different organs with time a UMAP projections of scRNA-seq data for the lung (n = 57,020), b esophagus (n = 87,947), and c spleen (n = 94,257). d–f Proportions of cells identified per donor and per time point for the d lung, e esophagus, and f spleen. g–j The single-cell UMAP plots for each organ with length of storage time highlighted. j Percent variance explained in the combined dataset by cell types, n counts, donor, tissue, and time points

