Fig. 4.
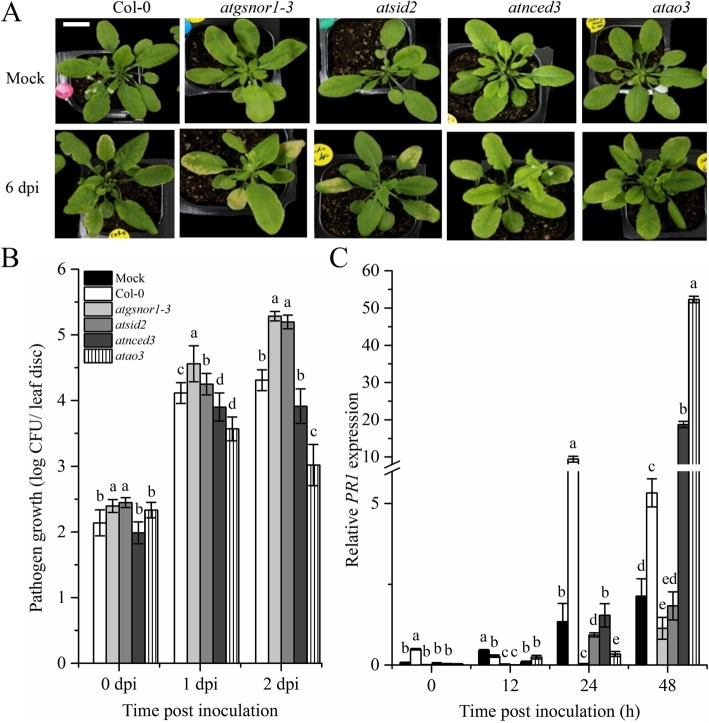
AtAO3 negatively regulates basal defense. a Symptom development at 6 dpi. b Pathogen growth from infiltrated leaves. c Relative PR1 expression after attempted virulent Pst DC3000 at 5 × 10⁵ colony forming units (CFU) mL− 1. The data points in panel (b) are the mean of five replicates, whereas those in panel (c) are the mean of three replicates. Background in panel (a) was modified for more clarity and white bar represents scale bar equal to 1 cm. The Y-axis of panel (c) was interrupted to clarify the small values. The experiments were repeated at least three times. Error bars represent ±SE. Different letters represents significant differences between means at p ≤ 0.05 (DMRT).

