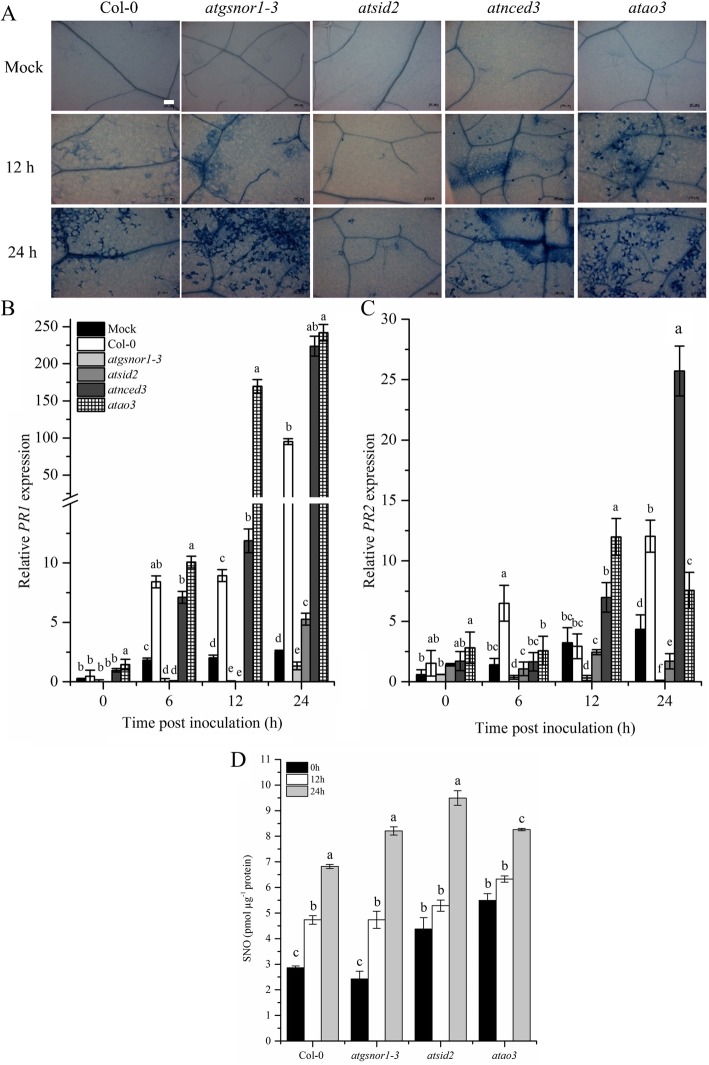
Fig. 5.
AtAO3 negatively regulates R-gene-mediated resistance. a ataao3 showed induced HR after Pst DC3000 (avrB) inoculation. b and c Relative transcript accumulation of PR1 and PR2 genes analyzed using quantitative real time PCR (qPCR) and (d) SNO measurement after Pst DC3000 (avrB) inoculation. The white small bar in WT mock plant in panel (a) represents scale bar and is equal ot 100 μM. The Y-axis of panel (b) was interrupted to clarify the small values. The expression was normalized against constitutively expressed Actin. Error bars represent ±SE. Different letters represents significant differences between means at p ≤ 0.05 (DMRT).

