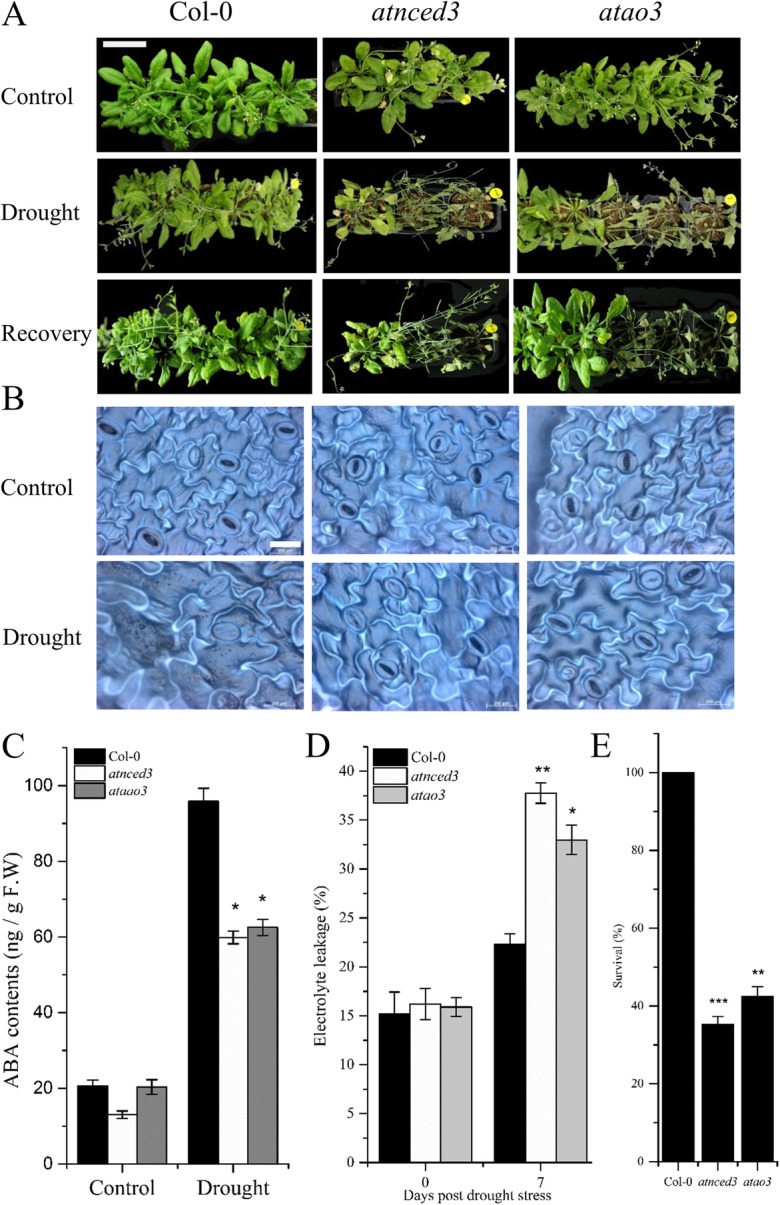
Fig. 7.

AtAO3 is required for drought tolerance. a Phenotypes of the indicated genotypes under control, drought, and recovery stage. b Stomatal structure in the indicated genotypes under control and drought stress. c ABA contents (from fresh samples) in response to drought stress and control conditions. d Electrolyte leakage (%) under control and drought conditions (e) Survival percentage after re-watering the plants for 24 h. The white bar in panel A represents scale bar and is equal to 4 cm while in B is equal ot 200 μM. Error bars represents ±SE. Significant differences are represented by asterisks (Student t-test). * represents p < 0.05, ** represents p < 0.01 and *** represents p ≤ 0.001.
