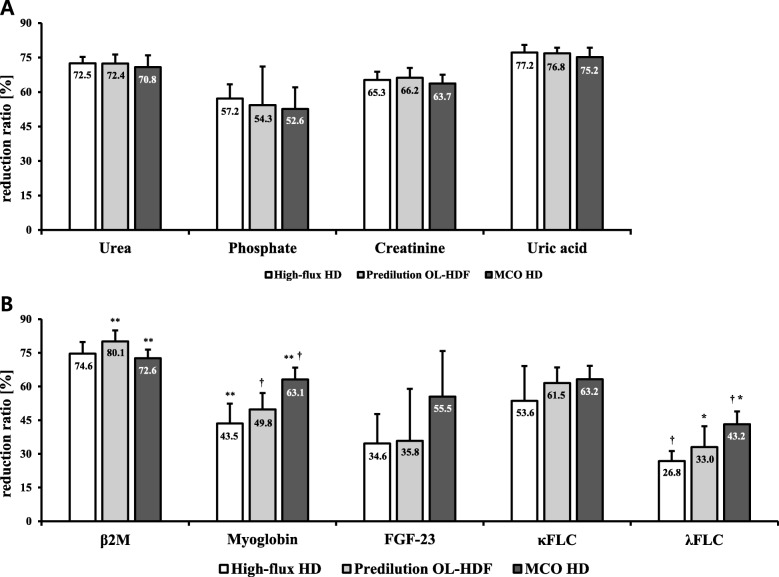
Fig. 1.
Bar graphs show reduction ratio (%) for the various uraemic toxins according to the treatment modalities. a Small water-soluble molecules. b Large (middle) molecules. Data are expressed as mean ± SDs. **†P < 0.05/3 = 0.0167, *P < 0.05 by the post hoc test using the linear mixed model with the least significant difference between two groups. SD: standard deviation; HD: haemodialysis; OL-HDF: online haemodiafiltration; MCO: membrane cut-off; β2M: β2-microglobulin; FLC: free light chain; FGF: fibroblast growth factor

