
Fig. 3.
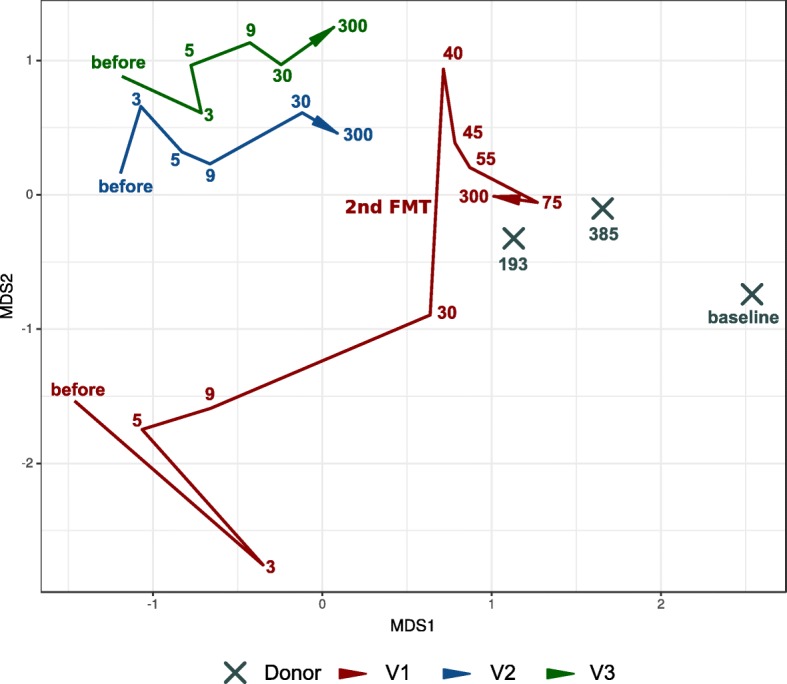
Movement of recipient samples to the donor during the observation time based on 16S rRNA gene sequencing taxonomic composition. Bi-dimensional plot obtained by Aitchison distance with the aid of DEICODE. Donor samples: X. Volunteer’s samples: red / blue / green colors (see figure legend). The lines denote the evolution of the volunteer’s samples in time (different time points). The days after FMT procedure (or baseline for donor samples) denoted by color numbers