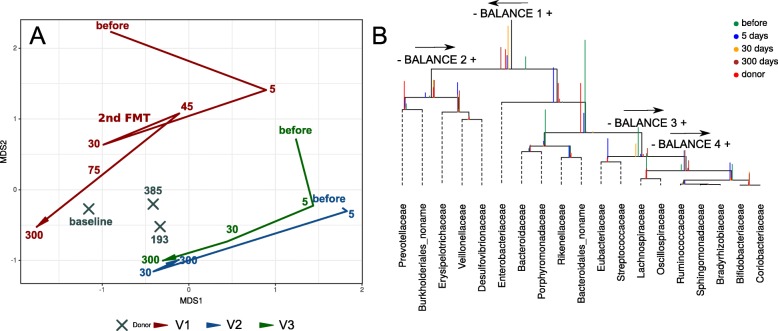
Fig. 4.
Shifts of the taxonomic profile of microbiota in volunteers towards donor values over the observation time. The figure is based on shotgun sequencing data. a on-metric multidimensional scaling bi-dimensional plot of MetaPhlAn2 taxonomic profile (genera level relative abundances), based on the Aitchison distance. The lines denote the evolution of the volunteer’s samples in time (different time points). The days after FMT procedure (or baseline for donor samples) denoted by numbers. b CoDa dendrogram which characterizes association of bacterial families, balances presented as edges. Decomposition of total variance by balances between groups of families is shown by vertical bars. Mean values of balances is shown by anchoring points of vertical bars. Color of vertical bars corresponds to time points. Color rectangles highlighted families belonging to important balances. The arrows direction indicates the predominance of this balance part in the donor. MOTUs with no family information are collapsed into the no-name family

