Fig. 5.
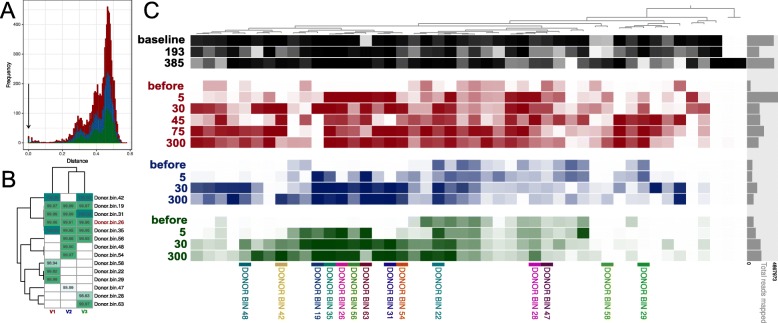
Comparison of similarity between donor and recipients metagenome-assembled genomes (MAGs). a The AA distance based on 43 marker proteins between all donor MAGs and all MAGs of all recipients. Arrow shows that some MAGs in donor and recipient is present with absolute similarity of marker genes sequence. b The average nucleotide identity (ANI) between similar donor and recipients MAGs. The MAGs with 100% AA similarity of 43 marker proteins were selected. c Anvi’o plot denoted prevalence of donor MAGs across all metagenomic samples. Detection value (proportion of nucleotides in a contig that are covered at least 1x (according to http://merenlab.org/2017/05/08/anvio-views) was used as an abundance metric, which is shown as color brightness. Black color denotes detection value of donor MAGs in the donor samples, red – in the V1 samples, blue – in the V2 samples, green – in the V3 samples. DONOR BIN – clusters of metagenome-assembled genomes similar to the donor bacteria. The days after FMT denoted by numbers. The mapping of recipient metagenomic reads to donor MAGs was performed with 100% similarity

