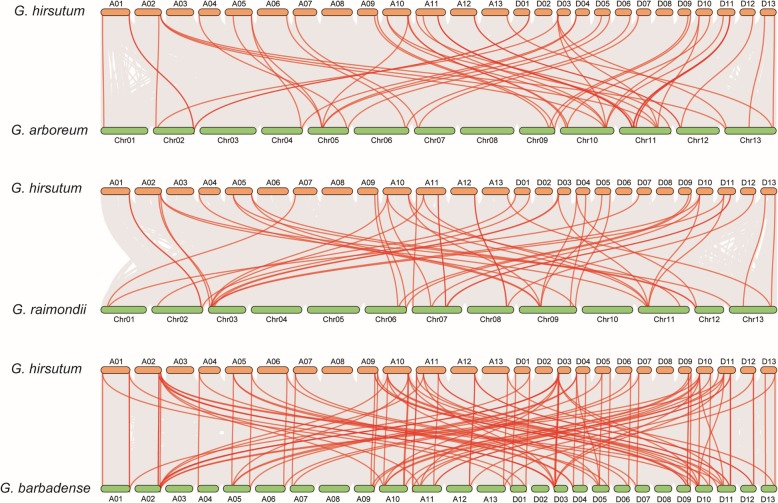
Fig. 2.
Collinearity analyses of SOT genes among G. hirsutum, G. barbadense, G. arboretum and G. raimondii. From top to bottom, three graphics displayed the collinear relationship between G. hirsutum and G. arboretum, G. hirsutum and G. raimondii, G. hirsutum and G. barbadense, respectively. Grey lines in the background showed the collinear relationship across the whole genome, while the red lines predominantly displayed the collinear SOT gene pairs

