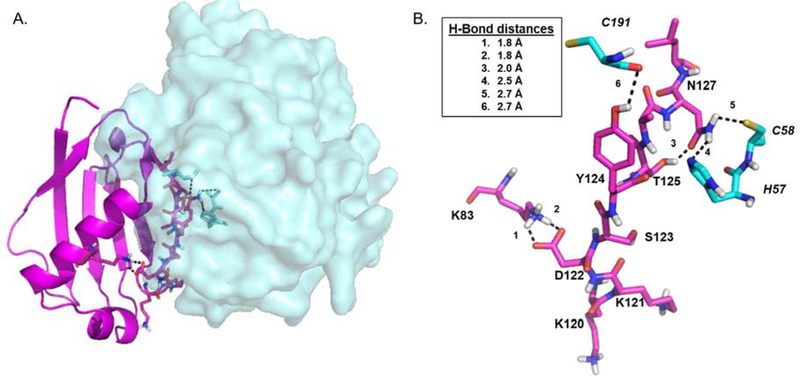
Figure 2. Energy minimized model of S. aureus EapH2:hNE.
(A) overall view of EapH2 (magenta, depicted as cartoon):hNE (cyan, depicted as space-fill). (B) Stick representation of EapH2 interface residues (magenta, normal font) and hNE residues (cyan, italic font). Potentially important Hydrogen bonds shown as black dashes. Inset: Hydrogen bond distances.

