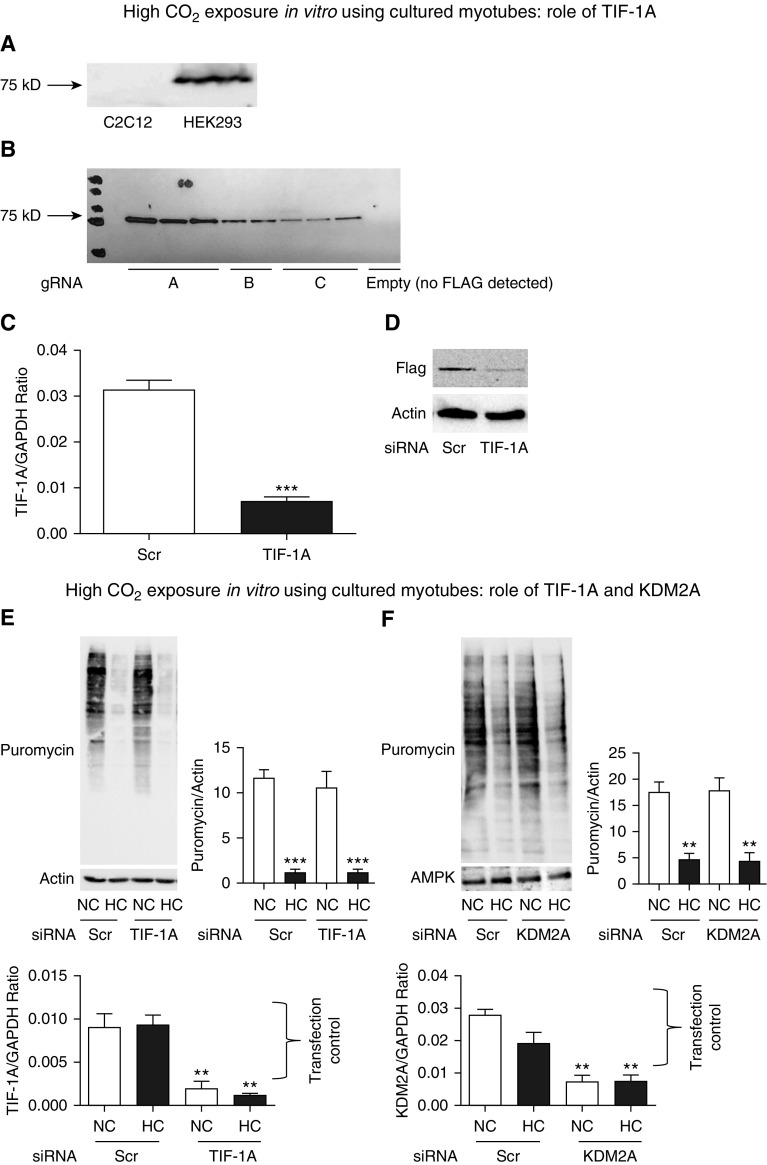
Figure 6.
CO2-driven skeletal muscle anabolic attenuation is independent of TIF1A and KDM2A. (A) Example of commercially available anti–TIF1A antibody that does not detect an approximately 75 kD band in lysates of C2C12 cells, whereas it does in HEK293 cells. (B) Cas9-expressing C2C12 cells were transfected with a donor clone holding the sequence of 3×FLAG and with three different guide RNAs (gRNA; A, B, and C) or no guide RNA (last lane with no FLAG detection) to localize the donor clone to exon 18 of the TIF1A gene. Cells were then lysed and immunoblotted with anti-FLAG antibody, demonstrating a band of approximately 75 kD (expected weight of TIF1A). (C) C2C12 cells from (B) (clone A) were transfected with Scr or specific TIF1A siRNA and then sampled for qPCR using TIF1A-amplifying primers, which demonstrate a decrease in the gene product in the siRNA-transfected group. GAPDH was used as a housekeeping control (n = 3). (D) The same C2C12 cells as in (C) were processed for Western blotting and probed with anti-FLAG antibody, demonstrating a significant decrease in the FLAG band intensity in the silenced group. Actin was used as a lane loading control (n = 3). (E) Myotubes were transfected with Scr or TIF1A siRNA and then exposed to NC or HC for 24 hours in the presence of puromycin-containing medium. Samples were then lysed and immunoblotted with antipuromycin antibody, and the intensity of the smears was interpreted as the amount of protein synthesis occurring in 24 hours. Actin was used as a lane loading control. Representative graphs depict results of qPCR with primers to amplify TIF1A and GAPDH used as a housekeeping control, demonstrating the siRNA transfection and silencing efficiency (n = 3). (F) Myotubes were transfected with Scr or KDM2A siRNA and then exposed to NC or HC for 24 hours in the presence of puromycin-containing medium. Samples were then lysed and immunoblotted with antipuromycin antibody, and the intensity of the smears was interpreted as the amount of protein synthesis occurring in 24 hours. Representative graphs depict the results of qPCR with primers to amplify KDM2A and GAPDH as a housekeeping control, demonstrating the siRNA transfection and silencing efficiency (n = 3). **P < 0.01 and ***P < 0.001. C2C12 = immortalized mouse myoblast cell line; Cas9 = CRISPR associated protein 9; FLAG = octapeptide sequence added to the TIF1A gene is DYKDDDDK; HEK293 = human embryonic kidney 293; KDM2A = lysine demethylase 2A; T1F1A = transcription intermediary factor 1-α.

