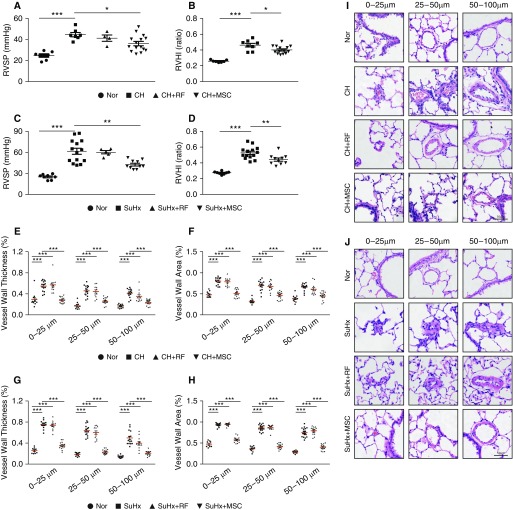
Figure 2.
MSCs partially attenuated established PH in CHPH and sugen hypoxia–induced (SuHx) PH rat models. (A–D) Representing right ventricular (RV) systolic pressure (RVSP; A and C) and RV/(LV+S) (B and D) reflecting RV hypertrophy in the CHPH model (A and B) and the SuHx-PH model (C and D) rats treated with or without MSC. (E–H) Vessel wall thickness and vessel wall area of the distal pulmonary artery sections (in different diameter) from the CHPH model (E and F) and the SuHx-PH model (G and H). Error bars represent means ± SEM (n = 7–15 in each group). *P < 0.05, **P < 0.01, and ***P < 0.001. (I and J) Hematoxylin and eosin staining of the lung sections from both CHPH model (I) and SuHx-PH model rats (J). Scale bars: 50 μm. LV = left ventricle; RF = rat fibroblast; RVHI = right ventricular hypertrophy index; S = septum.

