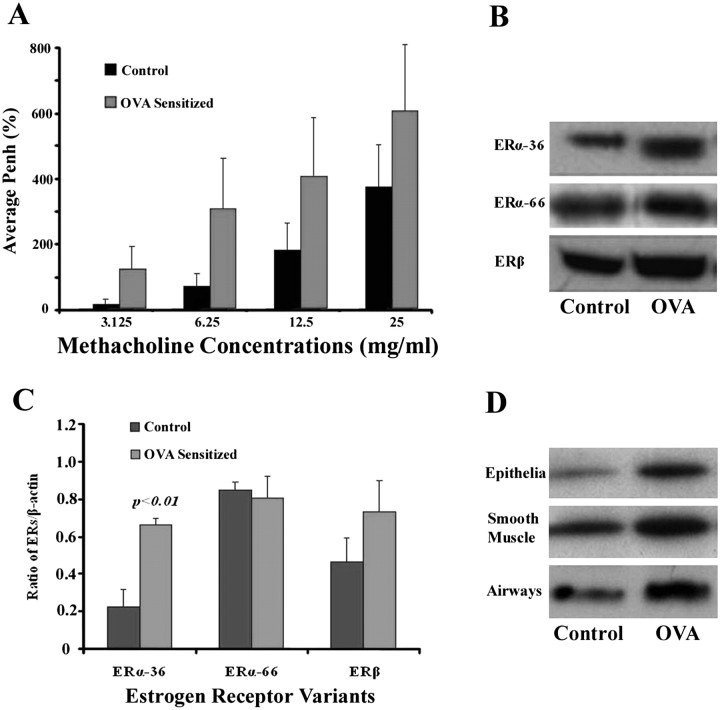
Figure 2.
Effect of ovalbumin (OVA) sensitization on airway hyperresponsiveness (AHR) and the expression of ERs. (A) Each bar represents the average values of enhanced pause (PenH) with different doses of methacholine. (B) Representative Western blot analysis of ER-α36, ER-α66, and ER-β in whole lung tissues of control and OVA-sensitized mice. (C) Each bar represents the average ratios of ERs/β-actin (three mice in each group) of control versus OVA-sensitized groups. Only the expression of ERα-36 increased significantly after ovalbumin sensitization (P < 0.01). (D) The elevation of ERα-36 associated with ovalbumin sensitization is confirmed in murine epithelia, smooth muscle, and whole airways. Each band represents the ERα-36 level, which was extracted from four mice in each group.

