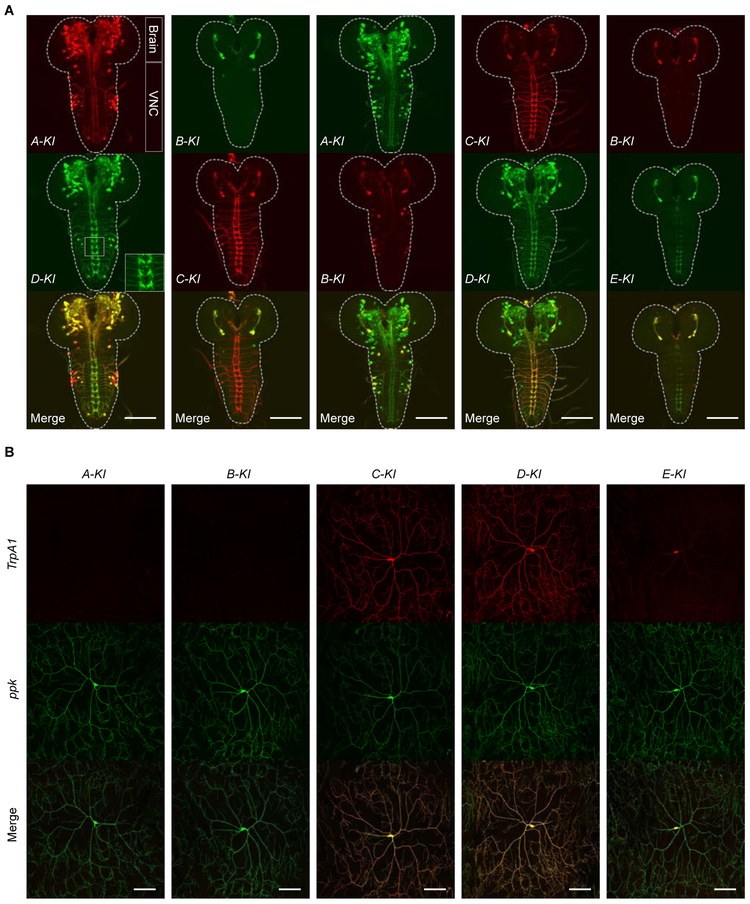
Figure 2. Alternative Splicing Specifies TrpA1 Isoform-specific Expression Patterns in Drosophila Larval Nervous System.
(A) Representative images showing TrpA1-positive cells in larval brain lobes and VNC, reported by translational driver lines for each of the five TrpA1 isoforms. Each vertical panel shows expression of a pair of TrpA1 isoforms and their overlap, in the transheterozygotes carrying TrpA1-X-KI-T2A-GAL4>UAS-6XGFP and TrpA1-Y-KI-T2A-lexA>lexAop2-6XmCherry. X and Y referred to different TrpA1 isoforms. The inset in the D-KI panel showed the axon projection patterns of C4da nociceptors in the VNC. Dashed lines outline the CNS boundary. Scale bar; 100 μm.
(B) Representative images showing expression of translational driver lines in larval C4da nociceptors, in transheterozygotes bearing TrpA1-isoform-KI-T2A-GAL4>UAS-CD4TdTamoto and C4da neuronal marker ppk-CD4TdGFP. Scale bar, 100 μm.
See also Figures S3, S4, S5.

