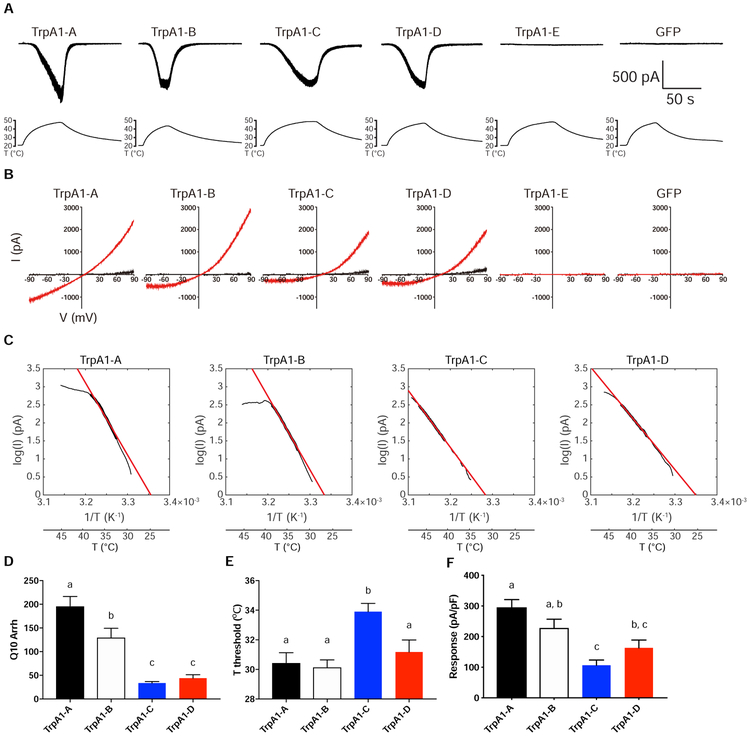
Figure 7. Heat Sensitivity of TrpA1 Isoforms in Drosophila S2 Cells.
(A) Sample traces of heat-induced current in S2 cells expressing TrpA1 isoforms. Temperature ramps were shown in the bottom accompanying each recoding trace.
(B) Sample I-V curves of heat-induced responses. Black I-V traces were obtained at room-temperature. Red I-V traces were acquired at the time point when temperature was at the peak and heat responses reached steady state.
(C) Sample Arrhenius plots (black trace) of heat-induced current in log unit over the inverse of absolute temperature. The portion of data used for linear fitting (red line) is indicated by the thickened black trace.
(D) Summary of Q10 values of TrpA1-A, B, C and D derived from Arrhenius plot.
(E) Summary of heat activation threshold of TrpA1-A, B, C and D.
(F) Summary of maximal heat responses of TrpA1-A, B, C and D.
n≥7 for each isoform. Data in D-F are represented as mean ± SEM. One-way ANOVA with Tukey’s post comparison test. Bars with different superscript (a, b and c) in D-F are significantly different from each other (p<0.05).

