
Figure 3. Travelling wave dynamics.
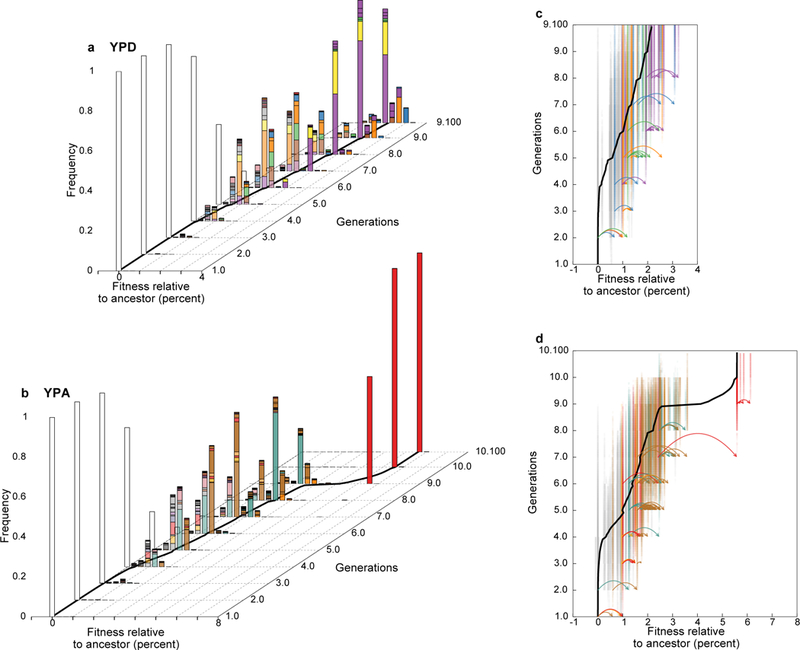
a, b Inferred distribution of fitness within the population through time. All fitnesses refer to average across evolution and barcoding conditions (SI section 6.2). Each colored bar denotes the frequency and fitness of a corresponding lineage in Fig. 2. White bar corresponds to the ancestor. Black line denotes inferred population mean fitness. c, d, Genealogical relationships among lineages show frequent leapfrogging events. Each clonal lineage is shown at its corresponding fitness; color opacity indicates lineage frequency. Colors of highlighted lineages shown in Fig. 2c, d are consistent with that figure; all other lineages are grey. Mutational events within highlighted lineages are shown as arrows; each event arises in one clonal lineage and founds a new lineage at a new fitness.