
Extended Data Figure 1: Allele frequency trajectories in the two populations, as detected from metagenomic sequencing.
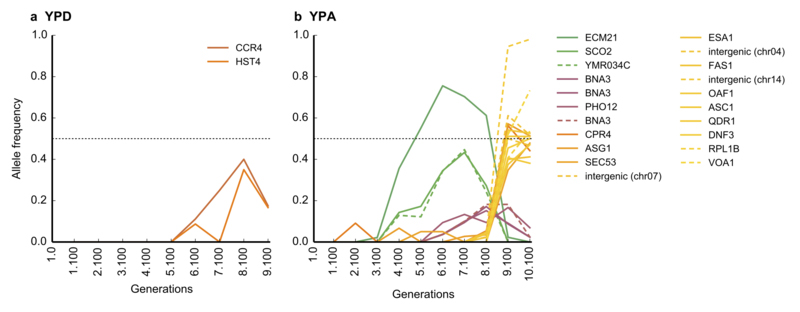
In both the YPD (a) and the YPA population (b), full lines denote missense and nonsense mutations, and dotted lines denote synonymous mutations and those falling in intergenic regions. Lines are colored according to the peak time of the trajectory. Note that a frequency of 50% (dotted line) corresponds to a mutation fixing as a heterozygote.