
Extended Data Figure 4: Genetic variation through time.
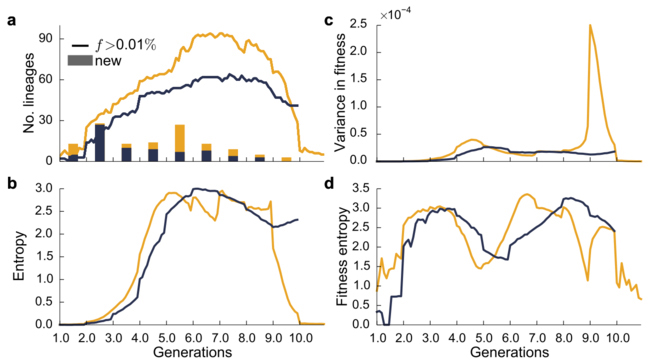
a, Total number of lineages above a threshold frequency (0.01%) through time; bars denote number of new lineages arising in each 100-generation interval. b, Genetic diversity within each population over time, as measured by entropy (SI section 6.4). c, Variance in fitness through time. d, Fitness diversity within each population over time, as measured by fitness entropy. Fitness entropy quantifies how fitness variance is distributed among lineages (SI section 6.4)