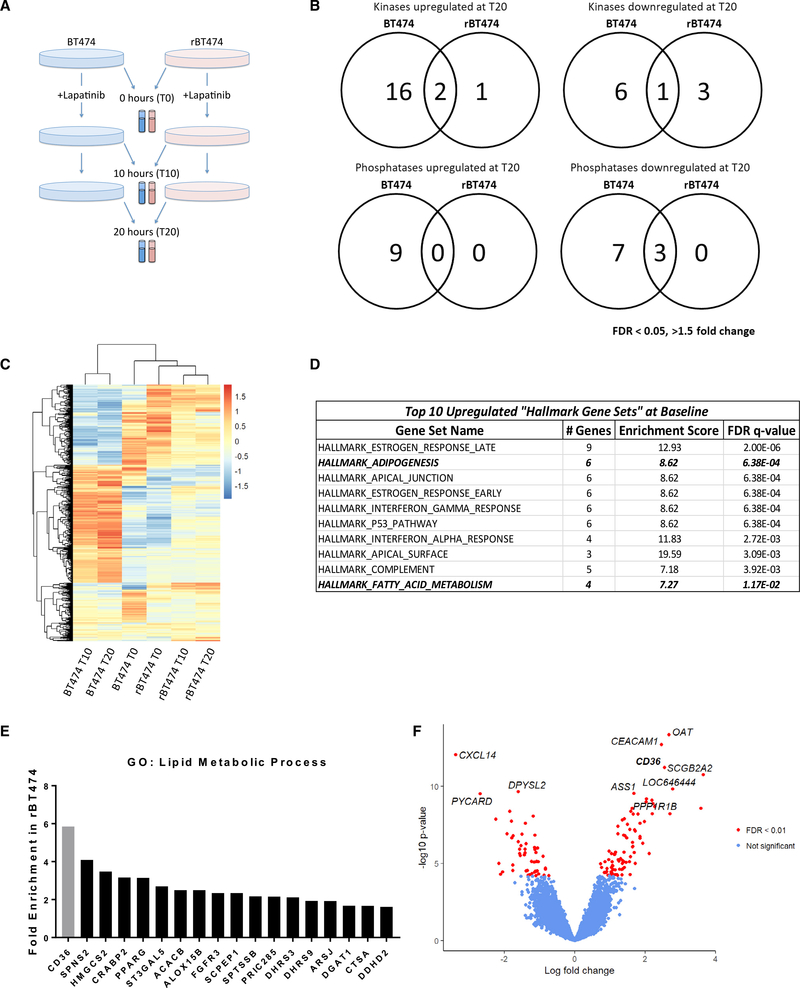
Figure 1. Lapatinib-Resistant BT474 Cells Differentially Express Genes Involved in Fatty Acid Metabolism.
(A) BT474 and rBT474 were harvested 0 (T0), 10 (T10), and 20 h (T20) after treatment with 1 μM lapatinib (n = 4 per treatment). Microarray analysis was performed using the Illumina Human HT-12 platform.
(B) Venn diagram representing all kinases and phosphatases that exhibit a 1.5-fold or greater change 20 h after 1 μM lapatinib treatment compared with untreated controls (FDR < 0.05).
(C) Hierarchical clustering of the top 1,000 genes with the highest variance after averaging across replicates. The color bar represents z-transformed expression values.
(D) Top 10 “Hallmark Gene Sets” upregulated in rBT474 compared with parental BT474 cells at baseline (T0). Bolded and italicized rows denote pathways directly related to lipid metabolism.
(E) Genes in the GO term “lipid metabolic process” found to be enriched in rBT474 cells and genes identified by microarray analysis of untreated cells at T0 (p < 0.01, FDR < 0.05, fold change > 1.5). CD36 is highlighted in gray.
(F) Volcano plot showing differential expression results comparing rBT474 and BT474 cells. In total, 137 of 22,013 genes were differentially expressed with FDR < 0.01. CD36 was among the most upregulated genes, with a log fold change of 2.5 (FDR = 3.5 × 10⁻⁸).

