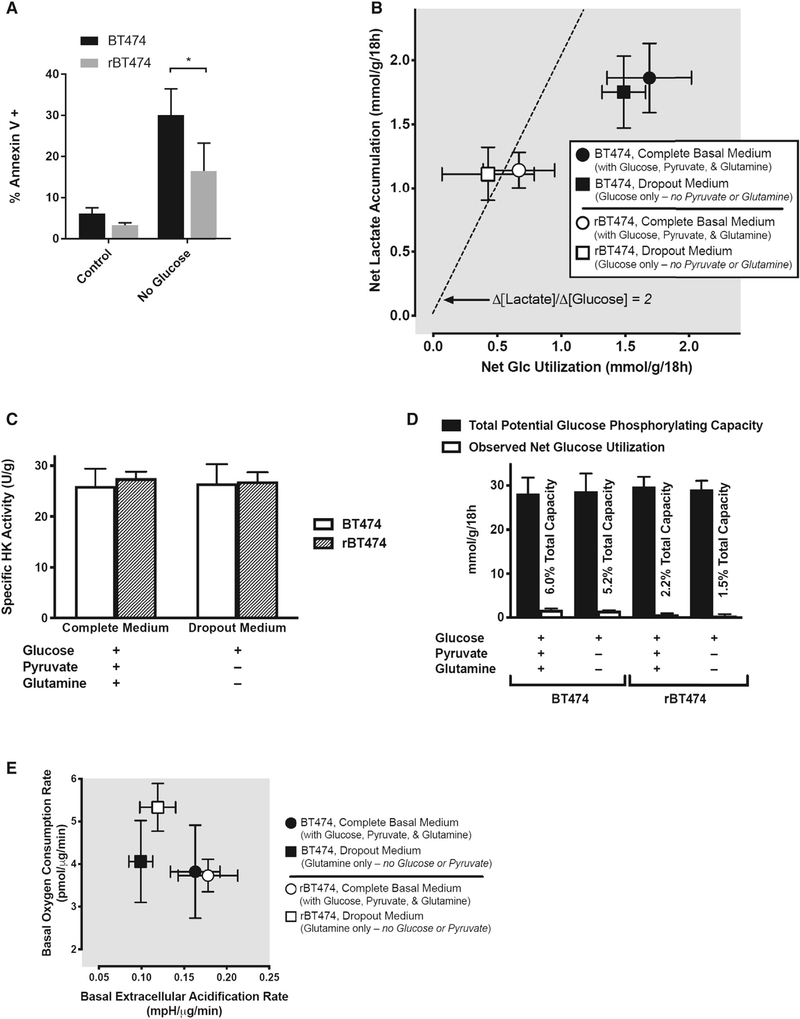
Figure 3. rBT474 Cells Exhibit a Preference for Glycolysis during Nutrient Abundance but Are Metabolically Plastic during Nutrient Stress.
(A) BT474 and rBT47 cells cultured in either complete medium (control) or glucose-deficient complete medium (no glucose) for 96 h were harvested and assayed for apoptosis as in Figure 2G from 3 experiments. Significance was assessed by non-paired Student’s t test, with significance set at *p < 0.05.
(B) rBT474 cells (open symbols) uniformly exhibited lower rates of both net glucose utilization and net lactate accumulation than wild-type BT474 cells (closed symbols), both in the presence (circles) and absence (squares) of the alternative energy substrates glutamine and pyruvate. In rBT474 cells, the stoichiometric ratio between lactate accumulation and glucose disappearance approximates that expected for the quantitative conversion of 6-carbon glucose to 3-carbon lactate in the absence of either lactate reutilization or non-glycolytic sources of lactate generation (broad dashes; Δ[lactate]/Δ[glucose] = 2). In contrast, both net glucose utilization and net lactate production are higher in BT474 cells, but the corresponding ratio is closer to unity in these cells (i.e., Δ[lactate]/Δ[glucose] ~1), suggesting that approximately half of their metabolized glucose is diverted to fates other than lactate. Data are depicted as means ± SEM from 6 consecutive experiments performed in duplicate (n = 5–6 for each data point).
(C) Total hexokinase activity did not differ between BT474 and rBT474 cells under the conditions examined in (B), suggesting that differences in net glucose utilization and lactate accumulation are not attributable to differences in total cellular glucose phosphorylating capacity.
(D) A quantitative pairwise comparison of the net glucose utilization rates depicted in (B) with the total glucose-phosphorylating capacities of BT474 and rBT474 cells revealed capacities for glucose phosphorylation–the first committed step of glucose metabolism (Robey et al., 2000)–that exceeded observed rates of glucose utilization by nearly 20-fold in BT474 cells and by over 45-fold in rBT474 cells, suggesting that differences in glucose utilization reflect metabolic control rather than capacity in these cells (Robey 2018).
(E) Both rBT474 cells and BT474 cells exhibited a substantial capacity for oxidative metabolism in complete medium (circles). rBT474 cells (open symbols), but not BT474 cells (closed symbols), also increased their basal oxygen consumption in glucose- and pyruvate-deficient medium containing glutamine as its principal energy substrate, consistent with an enhanced capacity for the oxidative metabolism of non-glycolytic substrates (e.g., exogenous glutamine or endogenous substrates such as lipids or amino acids) when exogenous glucose is unavailable. Mitochondrial stress testing during Seahorse metabolic flux analysis revealed that approximately half of the basal oxygen consumption in rBT474 cells was associated with oxidative phosphorylation (49% ± 1% versus 57% ± 1% in BT474 cells, n = 5–7). The remainder could be accounted for by either mitochondrial proton leak (27% ± 5% versus 28% ± 1% in BT474 cells) or non-mitochondrial oxygen consumption (24% ± 4% versus 15% ± 1% in BT474 cells). Data are depicted as the means ± SEM from 5–6 consecutive experiments performed in triplicate (n = 3–6 for each data point).

