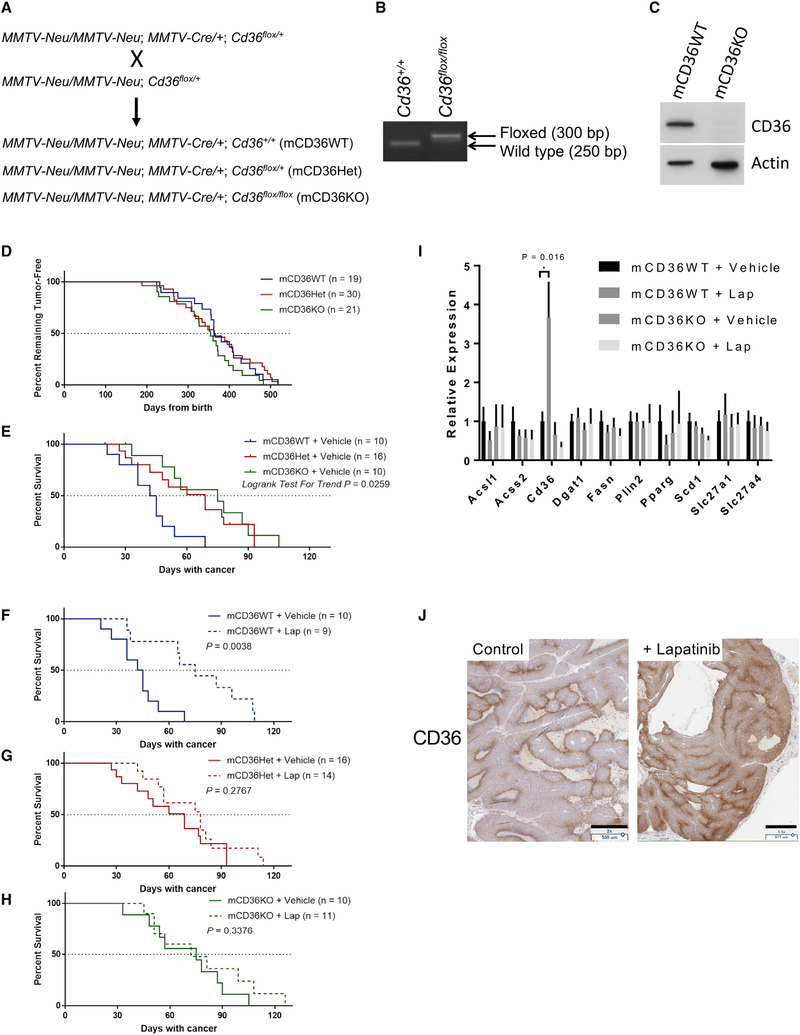
Figure 5. CD36 Expression Is Induced by HER2 Inhibition In Vivo and Predicts Survival.
(A) Mammary-specific Cd36 KO mice were generated by crossing three mouse lines: MMTV-neu, MMTV-Cre, and Cd36flox/flox. Cd36+/+, Cd36flox/+, or Cd36flox/flox female mice with two alleles of MMTV-neu and one allele of MMTV-Cre were produced (mCD36WT, mCD36Het, and mCD36KO, respectively).
(B) Mammary-specific Cd36 deletion was confirmed by PCR.
(C) Deletion of Cd36 was confirmed at the protein level by western blot.
(D) Kaplan-Meier curves depicting tumor latency of MMTV-neu mice, defined as time from birth until appearance of the first palpable tumor.
(E) Kaplan-Meier curves of vehicle-treated mCD36WT, mCD36Het, and mCD36KO mice.
(F–H) Kaplan-Meier curves of mCD36WT (F), mCD36Het (G), and mCD36KO (H) CD36-deficient mice treated with lapatinib or vehicle until a total tumor volume of 2,000 mm3 was reached. Significance was measured by log-rank test conducted using Prism v7.04.
(I) qRT-PCR analysis of tumors from mice analyzed in (E) for the panel of FA metabolism genes surveyed in Figure S1H. Mean ± SEM from 8–10 mice per group. Significance was assessed by non-paired Student’s t test, with significance set at *p < 0.05.
(J) Induction of CD36 was measured by immunohistochemistry. Scale bars indicate 500 μm (control) and 677 μm (+lapatinib).

