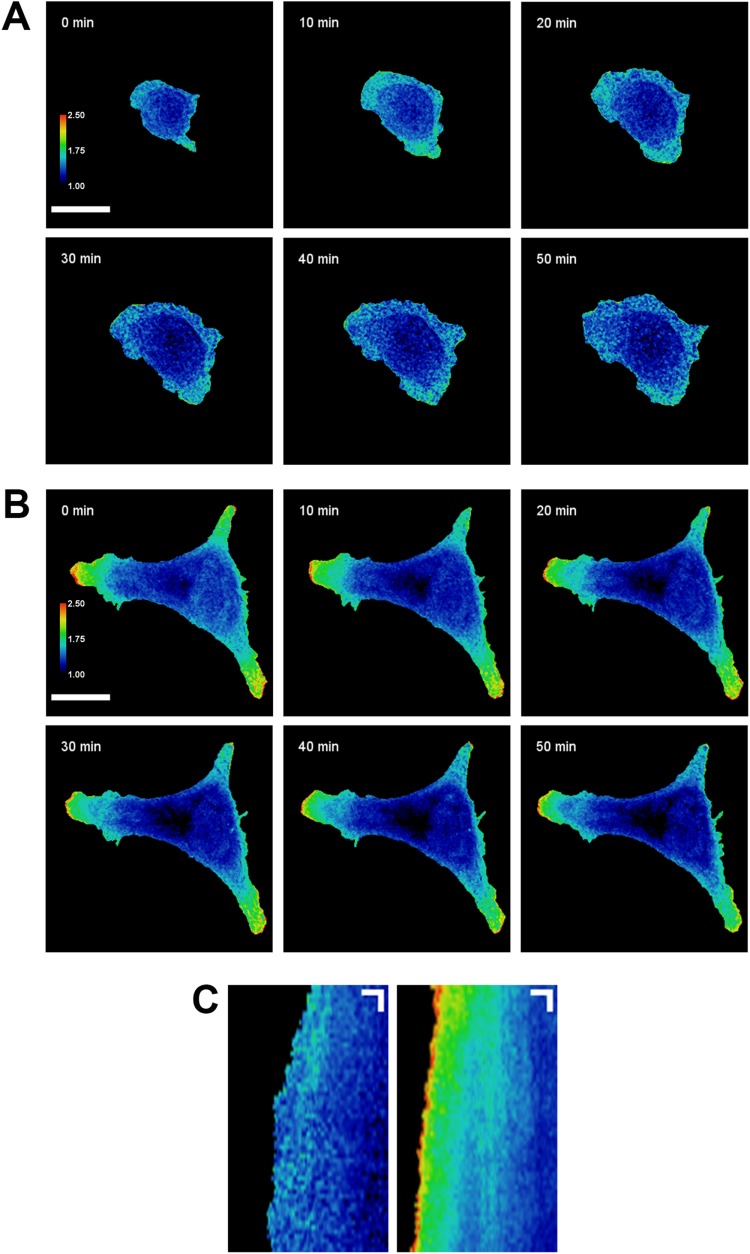
FIGURE 1:
PKA activity is increased at the leading edge of migrating cells but not at the periphery of spreading cells. SKOV-3 cells expressing pmAKAR3 were plated onto fibronectin-coated glass coverslips and imaged via FRET microscopy10 min (A) or 4 h (B) after plating. Representative pseudocolored FRET/CFP images of spreading (A) and migrating (B) cells are shown (bar = 25 µm). FRET ratios of each image are scaled from 1.0 to 2.5 (cool to warm color). (C) A linescan analysis of the change in centroid-to-front FRET ratio was performed on the spreading (left) and migrating (right) cells from A and B. Kymographs represent the FRET ratio along the linescans shown in Supplemental Movie S1 over the course of 1 h. Images were acquired every 60 s. Kymograph scale bars represent 5 µm on the X axis and 5 min on the Y axis.

