FIGURE 3:
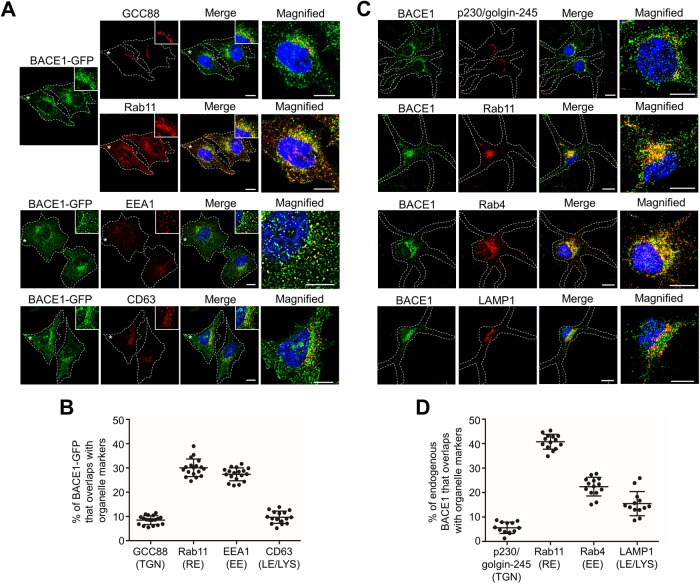
Steady-state distribution of BACE1 in HeLa cells and primary neurons. (A) HeLa cells stably expressing BACE1-GFP were fixed, permeabilized, and blocked, followed by staining with either rabbit anti-GCC88 (far-red converted to red/green) and mouse anti-Rab11 (red), mouse anti-EEA1 (red), or mouse anti-CD63 (red) antibodies and DAPI (blue). Insets and higher magnifications of the images of the cells marked * are also shown. Bars represents 10 μm. (B) The percentage of BACE1-GFP at the TGN, recycling endosomes, early endosomes, and late endosomes/lysosomes was calculated as the percentage of total BACE1-GFP pixels that overlapped with GCC88, Rab11, EEA1, and CD63, respectively, using the OBCOL plug-in on ImageJ. Data are represented as the mean ± SD of three independent experiments (n = 16). (C) Primary mouse cortical neurons at DIV7 were stained overnight with anti-rabbit BACE1 for endogenous BACE1 (green) and either human anti-p230/golgin-245 (red), rat anti-LAMP1 (red), mouse anti-Rab11 (red), or anti-Rab4 (red) antibodies at 4°C. Higher magnifications of the merged images are also shown. Bar represents 10 μm. (D) The percentage of endogenous BACE1 at the TGN, recycling endosomes, early endosomes, and late endosomes/lysosomes in neurons was calculated as the percentage of volume sum of BACE1 that overlapped with p230/golgin-245, Rab11, Rab4, and LAMP1, respectively, using Imaris. Data are represented as the mean ± SD of three independent experiments (n = 13–14).

