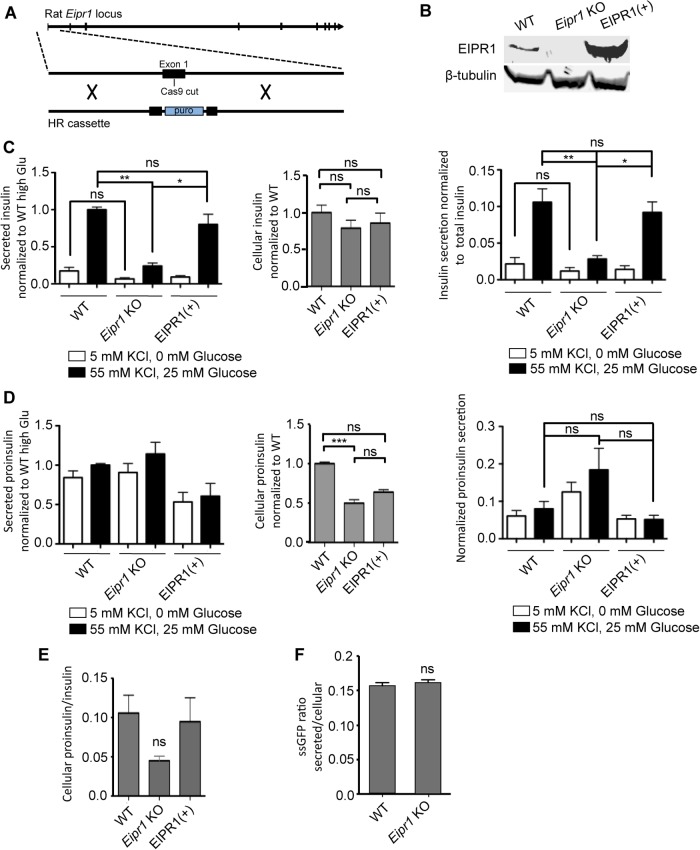
FIGURE 1:
Insulin secretion is reduced in Eipr1 KO cells. (A) Strategy used to create the Eipr1 KO 832/13 cell line. Cas9 was targeted to cut in the first exon of the rat Eipr1 locus and homologous recombination (HR) was used to insert a puromycin cassette. (B) Eipr1 KO cells do not express wild-type (WT) EIPR1. Protein extracts from 832/13 (WT), Eipr1 KO 832/13 (Eipr1 KO), and Eipr1 KO 832/13 cells expressing a WT Eipr1 cDNA (EIPR1[+]) were blotted with an EIPR1 antibody. β-Tubulin served as a loading control. (C) Left panel, insulin secretion under resting (5 mM KCl, 0 mM glucose) and stimulating conditions (55 mM KCl, 25 mM glucose) from 832/13 cells (WT), Eipr1 KO 832/13 cells (Eipr1 KO), and an Eipr1 KO stable line expressing WT Eipr1 (EIPR1[+]). All values were normalized to the value of the WT under stimulating conditions. n = 7; *, p < 0.05; **, p < 0.01; ns, p > 0.05; error bars = SEM. Middle panel, total insulin content in WT, Eipr1 KO, and EIPR1(+) cells. All values were normalized to the WT. n = 5–7; ns, p > 0.05; error bars = SEM. Right panel, insulin secretion normalized to insulin content under resting (5 mM KCl, 0 mM glucose) and stimulating conditions (55 mM KCl, 25 mM glucose) from WT, Eipr1 KO, and EIPR1(+) cells. n = 5–7; *, p < 0.05; **, p < 0.01; ns, p > 0.05; error bars = SEM. We performed three biological replicates. For each replicate, the same cells were used to determine the amount of insulin secreted under resting conditions, stimulating conditions, and the amount of total cellular insulin. (D) Left panel, proinsulin secretion under resting (5 mM KCl, 0 mM glucose) and stimulating conditions (55 mM KCl, 25 mM glucose) from WT, Eipr1 KO, and EIPR1(+) cells. All values were normalized to the value of the WT under stimulating conditions. n = 6; error bars = SEM. Middle panel, total proinsulin content in WT, Eipr1 KO, and EIPR1(+) cells. All values were normalized to the WT. n = 6; ***, p < 0.001; ns, p > 0.05; error bars = SEM. Right panel, proinsulin secretion normalized to proinsulin content under resting (5 mM KCl, 0 mM glucose) and stimulating conditions (55 mM KCl, 25 mM glucose) from WT, Eipr1 KO, and EIPR1(+) cells. All values were normalized to the WT under stimulating conditions. n = 6; ns, p > 0.05; error bars = SEM. We performed three biological replicates. (E) Ratio of total cellular proinsulin to total insulin. n = 4–6; ns, p > 0.05; error bars = SEM. (F) The absence of EIPR1 does not affect the constitutive secretory pathway. Eipr1 KO 832/13 cells secrete normal levels of ssGFP (GFP fused to a signal peptide at its N-terminus). Values of secreted GFP were normalized to total. n = 6; error bars = SEM. The data shown were combined from two independent experiments with similar results. The data shown for the WT are the same as shown in Figure 1D of Cattin-Ortolá, Topalidou, et al. (2019) because these experiments were run in parallel with the same WT control.

