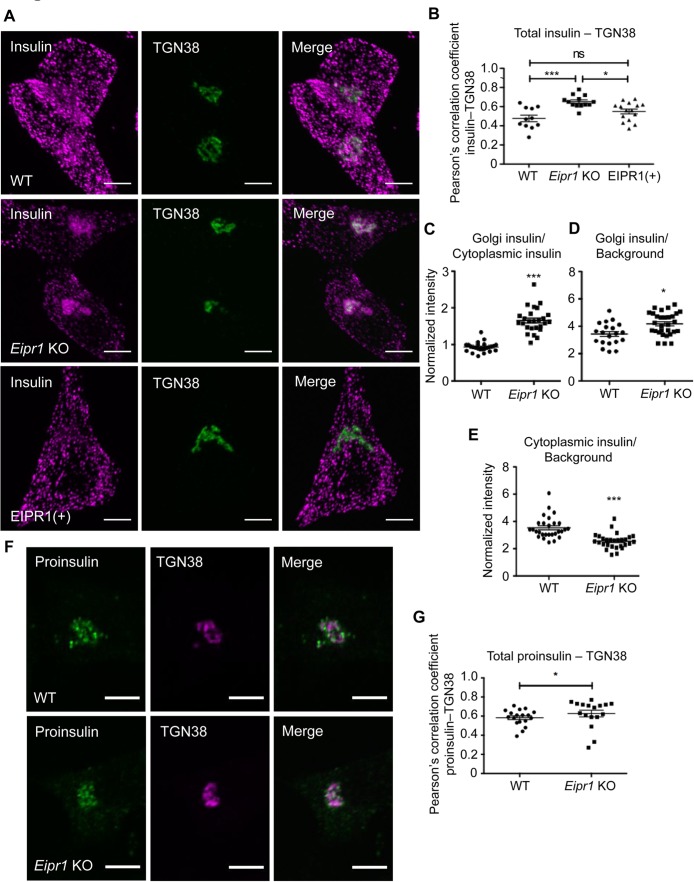
FIGURE 2:
Insulin localization is disrupted in Eipr1 KO cells. (A) Representative images of 832/13 (WT), Eipr1 KO 832/13 (Eipr1 KO), and Eipr1 KO 832/13 cells expressing WT Eipr1 (EIPR1[+]) costained for endogenous insulin and TGN38. In WT and EIPR1(+) cells, insulin is spread throughout the cytoplasm, but in Eipr1 KO cells insulin accumulates in a perinuclear region that partially overlaps with TGN38. The experiment was repeated three times, and the experimenter was blinded to the genotypes of the stained cells. Scale bars = 5 μm. (B) Pearson’s correlation coefficient was measured to quantify the localization between insulin and the TGN marker TGN38. n = 11 for WT, n = 13 for Eipr1 KO, and n = 15 for EIPR1(+); ***, p < 0.001; *, p < 0.05; ns, p > 0.05; error bars = SEM. The experiment was repeated three times. (C) Eipr1 KO cells have an increased Golgi/cytoplasmic ratio of insulin relative to WT cells. Fluorescence of a region of interest that includes the TGN divided by the fluorescence of a region of the same size in the cytoplasm, in WT and Eipr1 KO. (n = 25 for WT and Eipr1 KO; error bars = SEM; ***, p < 0.001). The data shown for the WT are the same as shown in Figure 2C of Cattin-Ortolá, Topalidou, et al. (2019) because these experiments were run in parallel with the same WT control. (D) Eipr1 KO cells have a slightly increased amount of insulin localized at or near the TGN. Fluorescence of a region of interest that includes the TGN divided by the fluorescence of a region of the same size in the background, in WT and Eipr1 KO. (n = 20 for WT and n = 30 for Eipr1 KO; error bars = SEM; *, p < 0.05). (E) Eipr1 KO cells have a decreased amount of insulin localized to the cytoplasm. Fluorescence of a region of interest in the cytoplasm divided by the fluorescence of a region of the same size in the background (n = 28 for WT and Eipr1 KO; error bars = SEM;***, p < 0.001). (F) Representative images of 832/13 (WT) and Eipr1 KO 832/13 (Eipr1 KO) cells costained for endogenous proinsulin and TGN38. In both WT and Eipr1 KO cells, proinsulin is localized in a perinuclear region that partially overlaps with TGN38. Scale bars = 5 μm. (G) Pearson’s correlation coefficient was measured to quantify the localization between proinsulin and the TGN marker TGN38. n = 18 for WT and n = 17 for Eipr1 KO; *, p < 0.05; error bars = SEM. The experiment was repeated three times.

