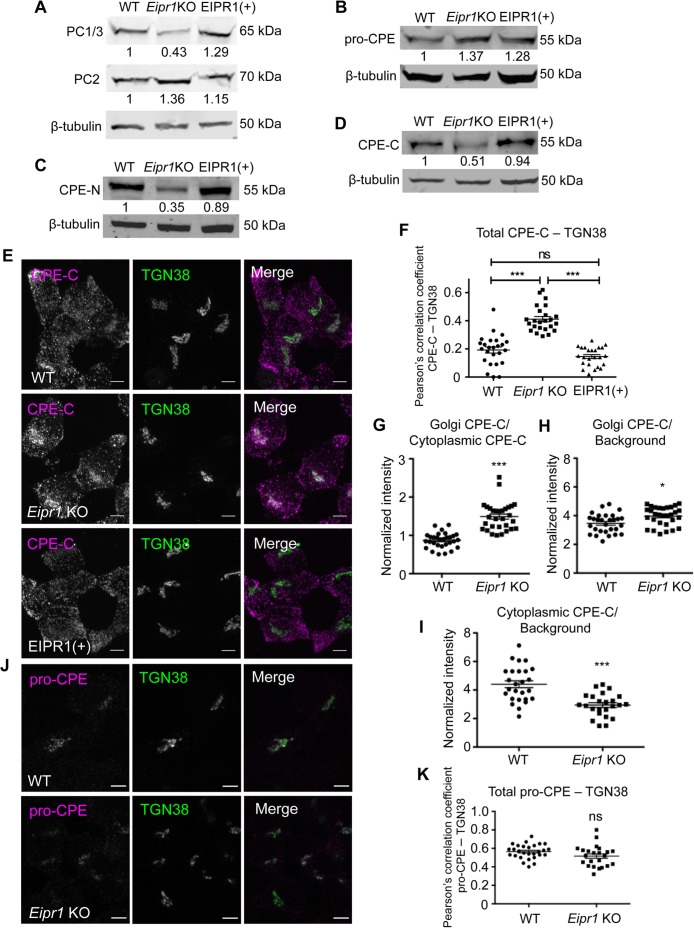
FIGURE 3:
EIPR1 is required for normal levels and distribution of mature DCV cargoes. (A) Eipr1 KO cells have reduced levels of the processed form of the proprotein convertase PC1/3 but normal levels of PC2. Lysates from WT, Eipr1 KO, and EIPR1(+) 832/13 cells were blotted with an antibody to PC1/3 or PC2. β-Tubulin was used as a loading control. Shown are representative blots of three independent experiments with similar results. (B) The levels of the unprocessed form of CPE (pro-CPE) are not affected by the loss of EIPR1. Lysates from the indicated cell lines were blotted with an antibody to pro-CPE. The experiment was repeated three times with similar results. The data shown for the WT are the same as shown in Figure 3B of Cattin-Ortolá, Topalidou, et al. (2019) because these experiments were run in parallel with the same WT control. (C, D) Eipr1 KO cells have reduced levels of the processed form of CPE. Detergent lysates from WT, Eipr1 KO, and EIPR1(+) 832/13 cells were blotted with an antibody to the N-terminus of CPE (CPE-N) or the C-terminus of CPE (CPE-C). β-Tubulin was used as a loading control. The experiment was repeated three times. The data shown for the WT in Figure 3C are the same as shown in Figure 3C of Cattin-Ortolá, Topalidou, et al. (2019) because these experiments were run in parallel with the same WT control. (E) The mature processed form of CPE is localized at or near the TGN in Eipr1 KO cells. Representative confocal images of WT, Eipr1 KO, and EIPR1(+) cells costained with the CPE C-terminal antibody (CPE-C) and TGN38. Maximum intensity projections. Scale bars = 5 μm. The experiment was repeated three times with similar results. (F) Quantification of the colocalization between the mature form of CPE (CPE-C) and the TGN marker TGN38. Maximum intensity projection images were obtained and Pearson’s correlation coefficients were determined by drawing a line around each cell. (n = 25 for WT; n = 24 for Eipr1 KO; n = 24 for EIPR1(+); error bars = SEM; ***, p < 0.001; ns, p > 0.05). (G) Eipr1 KO cells have an increased Golgi/cytoplasmic ratio of CPE relative to WT cells. Fluorescence of a region of interest that includes the TGN divided by the fluorescence of a region of the same size in the cytoplasm, in WT and Eipr1 KO. (n = 30 for WT and Eipr1 KO; error bars = SEM; ***, p < 0.001). The data shown for the WT are the same as shown in Figure 3G of Cattin-Ortolá, Topalidou, et al. (2019) because these experiments were run in parallel with the same WT control. (H) Eipr1 KO cells have an increased amount of mature CPE localized at the Golgi. Fluorescence of a region of interest at the Golgi divided by the fluorescence of a region of the same size in the background, in WT and Eipr1 KO. (n = 29 for WT and n = 31 for Eipr1 KO; error bars = SEM; *, p < 0.05). (I) Eipr1 KO cells have a decreased amount of mature CPE localized to the cytoplasm. Fluorescence of a region of interest in the cytoplasm divided by the fluorescence of a region of the same size in the background (n = 26 for WT and n = 24 for Eipr1 KO; error bars = SEM; ***, p < 0.001). (J) The unprocessed form of CPE (pro-CPE) is localized at or near the TGN in both WT and Eipr1 KO cells. Representative confocal images of WT and Eipr1 KO cells costained for pro-CPE antibody and TGN38. Single slices. Scale bars = 5 μm. The experiment was repeated twice. (K) Quantification of the colocalization between the unprocessed form of CPE (pro-CPE) and the TGN marker TGN38. Maximum intensity projection images were obtained and Pearson’s correlation coefficients were determined by drawing a line around each cell. (n = 28 for WT; n = 23 for Eipr1 KO; error bars = SEM; ns, p > 0.05).

