FIGURE 8:
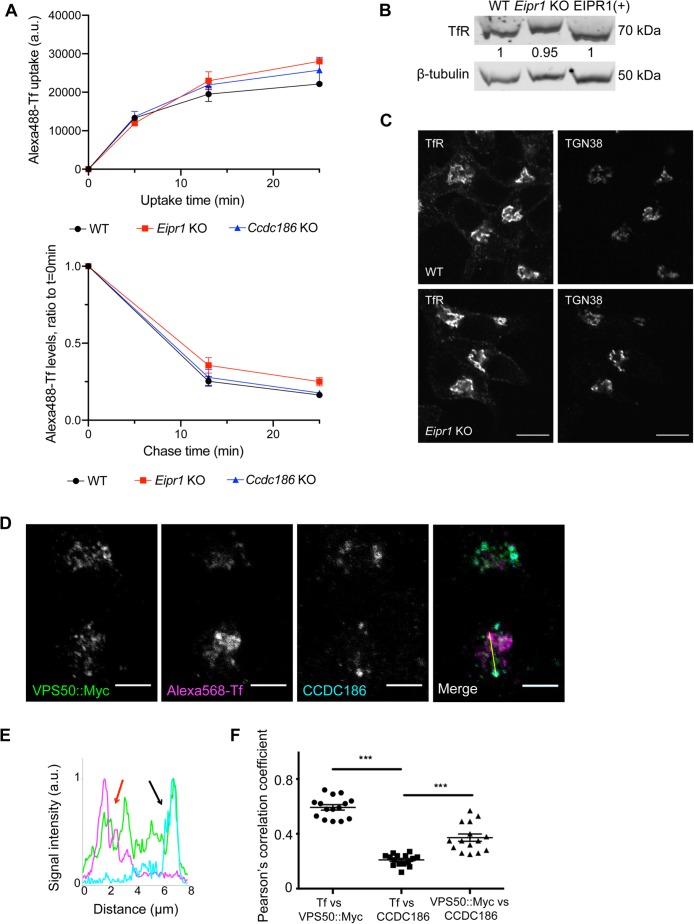
EIPR1 has a slight defect in transferrin recycling in insulinoma cells and EARP localizes to two distinct compartments. (A) EIPR1, but not CCDC186, has a slight defect in transferrin (Tf) recycling. FACS analysis of Alexa 488–labeled transferrin in WT, Eipr1 KO, and Ccdc186 KO cells after transferrin uptake for the indicated times (top) and at different chase times following 25-min transferrin uptake (bottom). The top plot represents the median of Alexa 488–Tf intensity of the population of cells as a function of time. The bottom plot represents the median of Alexa 488–Tf intensity of the population of cells at each time point normalized to the median intensity at t = 0 as a function of time. The experiment was repeated three times. For Tf uptake at 25 min, p = 0.16, WT vs. Eipr1 KO. For Tf recycling at 25 min, p = 0.11, WT vs. Eipr1 KO, one-way ANOVA with Bonferroni correction for multiple comparisons. (B) Levels of expression of the transferrin receptor (TfR) are not affected in Eipr1 KO cells. Protein extracts from 832/13 (WT), Eipr1 KO 832/13 (Eipr1 KO), and Eipr1 KO 832/13 cells expressing WT Eipr1 (EIPR1[+]) were blotted with an antibody against (TfR). β-Tubulin served as a loading control. (C) Localization of the TfR is not affected in Eipr1 KO cells. Representative images of 832/13 (WT) and Eipr1 KO (Eipr1 KO) 832/13 cells costained with antibodies for endogenous TfR and TGN38. Scale bars = 5 μm. (D–F) EARP localizes to two distinct compartments: a CCDC186-positive compartment near the TGN and immature DCVs and a transferrin-positive compartment that is associated with endosomes. 832/13 cells were transiently transfected with Myc-tagged VPS50, incubated with Alexa 568–labeled transferrin (Tf), and immunostained for Myc and CCDC186. (D) Representative confocal images of cells costained for endogenous CCDC186, Alexa 568–Tf, and VPS50::Myc. Scale bars = 5 μm. (E) The graph shows a representative intensity plot of normalized signal intensity vs. distance across the yellow line shown in D. VPS50::Myc is shown in green, Alexa 568–Tf is in magenta, and CCDC186 in cyan. Red arrow: overlap between VPS50 and Tf. Black arrow: overlap between VPS50 and CCDC186. (F) Pearson’s correlation coefficient was measured to quantify the localization between transferrin and VPS50::Myc, transferrin and CCDC186, and CCDC186 and VPS50::Myc. n = 15; ***, p < 0.001; error bars = SEM. The experiment was repeated twice.

