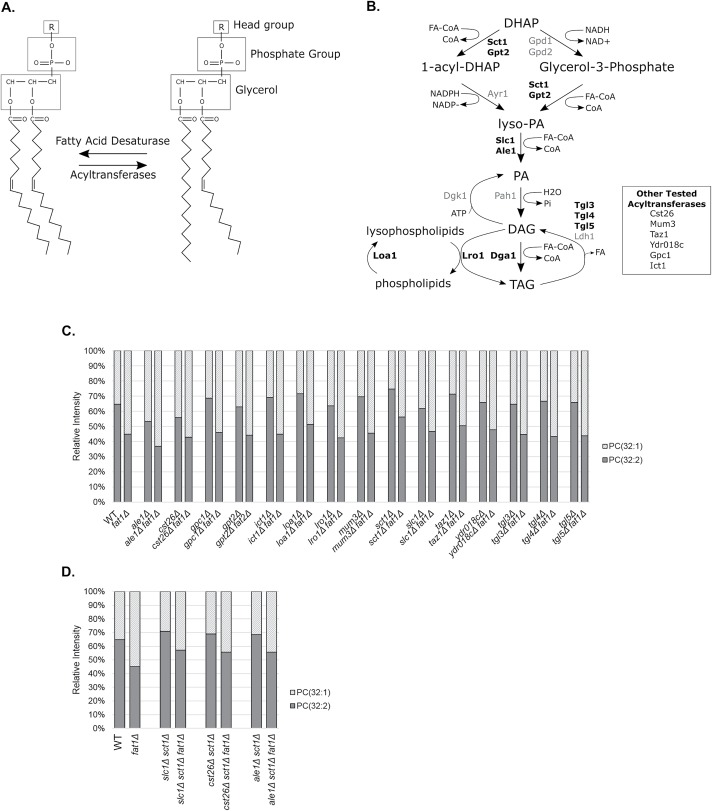
FIGURE 4:
Persistence of fat1Δ-induced PC saturation in diverse acyltransferase mutants. (A) Schematic diagram of phospholipid saturation. Increased fatty acid saturation could result from the increased activity of an acyltransferase that preferred saturated fatty acids or from decreased activity of the sole fatty acyl desaturase in yeast, Ole1. (B) Schematic diagram highlighting the role of selected acyltransferases and potential acyltransferases in lipid metabolism. DHAP, dihydroxyacetone phosphate; PA, phosphatidic acid; lyso-PA, 1-acyl-glycerol-3-phosphate; DAG, diacylglycerol; TAG, triacylglycerol; FA, fatty acid; FA-CoA, fatty acyl-CoA. (C, D) Relative intensity of PC (32:2 and 32:1) in the indicated strains. The fraction of each species as a total of the sum of the two species is plotted. Similar results were obtained in at least two independent experiments. Many of the mutant pairs were analyzed in more than four independent experiments. These experiments were performed using LESA MS.

