
Figure 2.
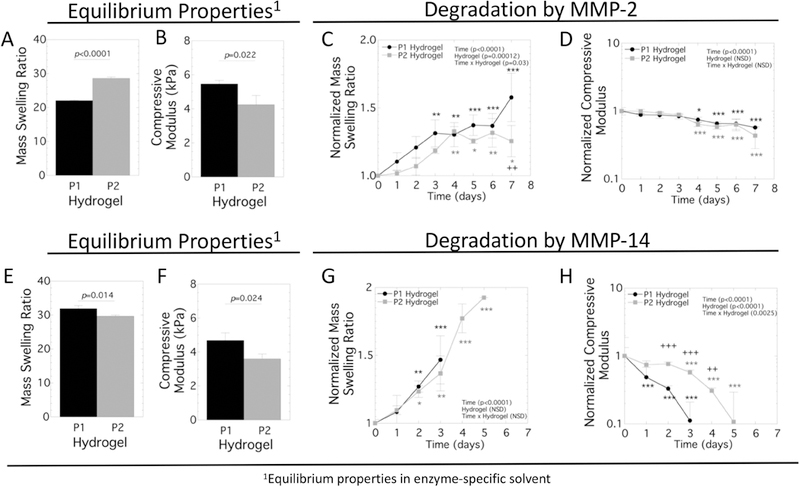
Characterization of the acellular MMP-sensitive hydrogels formed with the P1 and P2 crosslinkers. The equilibrium hydrogel properties were initially measured in the swelling solvent appropriate for enzyme (see materials and methods) after 48 hours and then measured as a function of time in the presence of enzyme, with time 0 days indicating when the enzyme was introduced. For MMP-2, the equilibrium properties prior to exposure to enzyme are shown for A) mass swelling ratio and B) compressive modulus. In the presence of MMP-2, C) mass swelling ratio normalized to the equilibrium mass swelling ratio and D) compressive modulus normalized to the equilibrium compressive modulus are reported as a function of time. For MMP-14, the equilibrium properties prior to exposure to enzyme are shown for E) mass swelling ratio and F) compressive modulus. In the presence of MMP-14, C) mass swelling ratio normalized to the equilibrium mass swelling ratio and D) compressive modulus normalized to the equilibrium compressive modulus are reported as a function of time. The enzyme concentrations were 0.5 nM MMP-2 or 1.5 nM MMP-14. P1 hydrogel is shown in black in the bar graphs or with black circles in the line plots. P2 hydrogel is shown in gray in the bar graphs or with gray squares in the line plots. Data are shown as mean with standard deviation as error bars (n=3). A two-way fixed ANOVA was performed and p-values are reported for the main effects of time and hydrogel and their interaction. The asterisks at a given time point indicate significant differences from the initial time point (* p<0.05, ** p<0.01, and *** p<0.001) with the black and gray correlating to P1 and P2 hydrogels, respectively. The + symbol indicates significance difference between the P1 and P2 hydrogels (++ p<0.01 and +++ p<0.001).