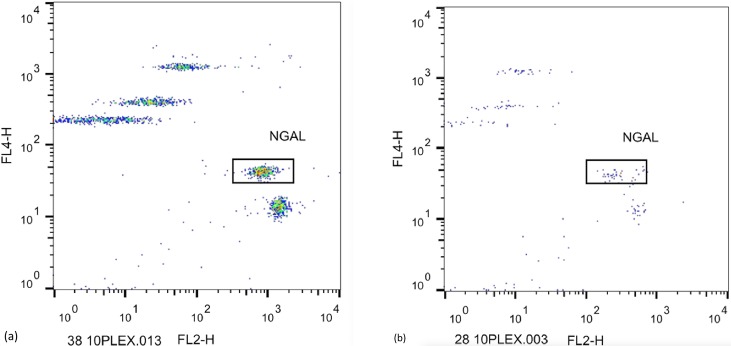
Fig 2. Examples from the expression of NGAL in two cases.
Each dot-plot has two parameters. FL2 (horizontal axis) represents the fluorescence intensity related to the concentration of measured factors such as NGAL (framed in a box) and the FL4 (vertical axis) represents the fluorescent intensity by which all measured factors in the same kit are distinguished, allocating them on different sites in the plot.

