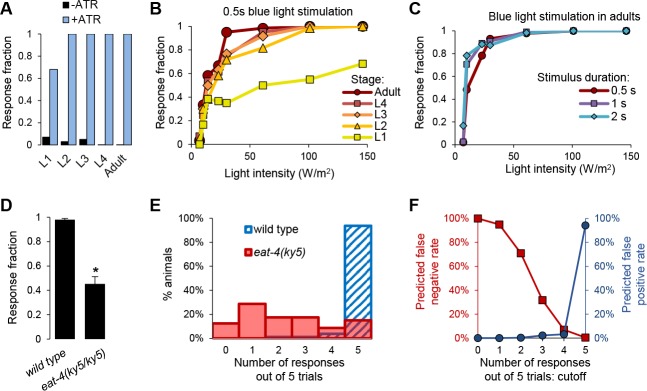
Fig 2. Determination of the screen conditions to identify genes required for FLP-evoked reversals.
A: Comparison of reversal induction between [FLP::CoChR] animals grown in the absence (-ATR) or the presence (+ATR) of all-trans-retinal (ATR) and stimulated with 146 W/m2. (n = 60 animals per condition). B: Light dose response curves in [FLP::CoChR] animals during their development from L1 larvae to adults. Each animal (n = 60 per condition) was stimulated once for 0.5 s at the indicated light intensities. C: Light dose response curves in [FLP::CoChR] adult animals as in B, with varying light stimuli durations. D: Fraction of trials triggering a reversal response in wild type ([FLP::CoChR] background) and eat-4(ky5) mutants used as a positive control. Each animal was stimulated five times. *, p < .01 by Student’s t-test. E: Distribution of the number of responded trials from the experiment in D. Most wild type animals respond to 5 out of 5 trials, while the response rate is widespread in the eat-4 mutant. F: Predicted false positive and false negative rates based on the comparison in E, according to different possible response cutoffs. A cutoff of “3 or less responded trials out of 5” was chosen to retain mutants during the initial screen.

