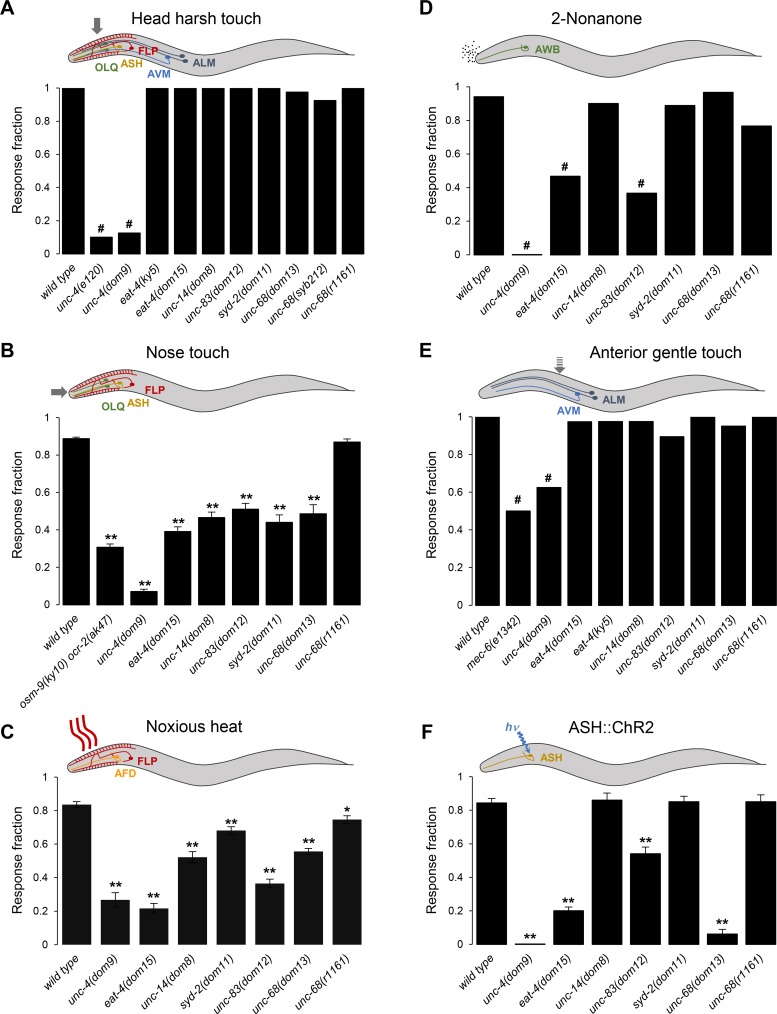
Fig 5. Gene-specific patterns of aversive behavior impairments in mutants.
Quantification of reversal behavior induced by stimuli detected dependently (A, B, C) and independently (D, E, F) of FLP. Stimuli were head harsh touch (A), nose touch (B), noxious heat (C), the chemical repellent 2-nonanone (D), gentle anterior touch (E), and optogenetic activation of the ASH nociceptor neuron in an [ASH::ChR2] transgenic background (F). Schemes at the top of each panel illustrate the stimuli and the sensory neurons involved. (A, D, E) Bars indicate the fractions of trials triggering a response. n≥ 40 animals, each tested with a single stimulus. #, p < .01 versus wild type by Bonferroni-corrected repeated Fisher’s exact tests. (B, C, F) Bars indicate the average fractions of trials triggering a response (with SEM as error bars). n≥ 40 animals, each tested with five (C, F), or ten (B) stimuli. *, p < .05 and **, p < .01 versus wild type by Dunnett’s tests.

