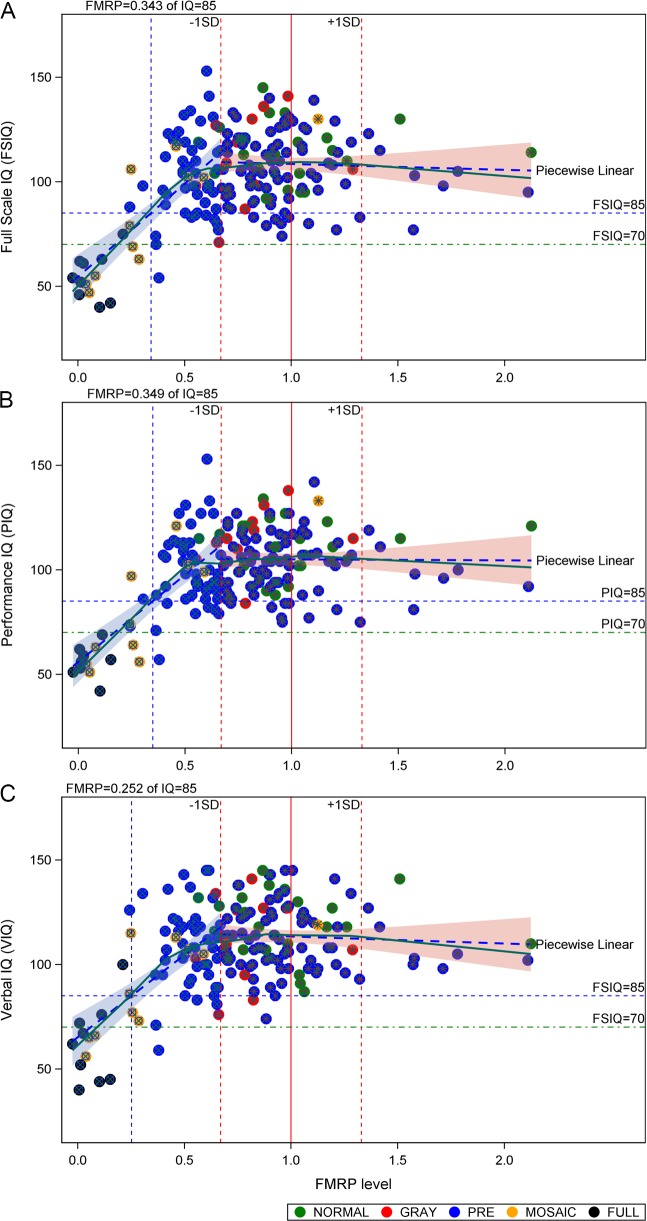
Fig 2. Dependence of IQ on FMRP levels in cultured dermal fibroblasts, accounting for sex as a covariate.
(A) FSIQ, (B) PIQ, and (C) VIQ were determined using age-appropriate instruments as delineated in the Methods section. FMRP levels were determined using FRET. All FMRP levels were normalized to the mean value of FMRP levels (= 1.0) among individuals with normal CGG repeats, excluding the FMR1 point mutation (1016–15). Data displayed are for both males and females since there is no significant differential dependence of the regression lines on sex (P > 0.05, see S1 Table); separate regression analyses for males and for females are displayed in S3A–S3F Fig. Symbols specify allele classes as indicated. Plus/minus 1 SD for FMRP levels are indicated as red vertical dashed lines. Lower limit of normal IQ (= 85) and borderline IQ (= 70) are indicated as horizontal blue and green dashed lines, respectively. The FMRP level at which the regression line for IQ passes 85 is indicated by a vertical (blue) dashed line.

