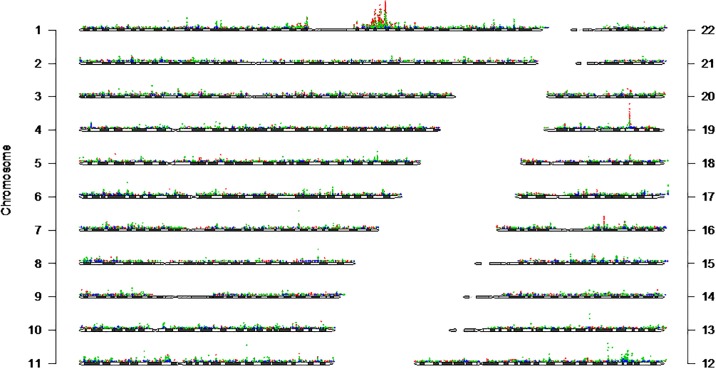
Fig 2. All genetic tests of association results, by PAGE study.
Results from all tests of association for SNPs with a minor allele frequency >1% regardless of phenotype at p<5x10⁻⁴ were plotted across chromosomes 1–22. Each dot on the plot represents the −log10(p-value) for the test of the association, and each of the three PAGE studies is plotted with a different color, Multiethnic Cohort (MEC) in blue, Women’s Health Initiative (WHI) in green, and Atherosclerosis Risk in Communities (ARIC) in red. The most significant p-value plotted here is 8.01E-44 for OLFML2B rs6676438 and (natural log) white blood count in ARIC (see Table 2). The y-axis for each chromosome is the −log10(p-value), and the x-axis is chromosomal base pair location.

