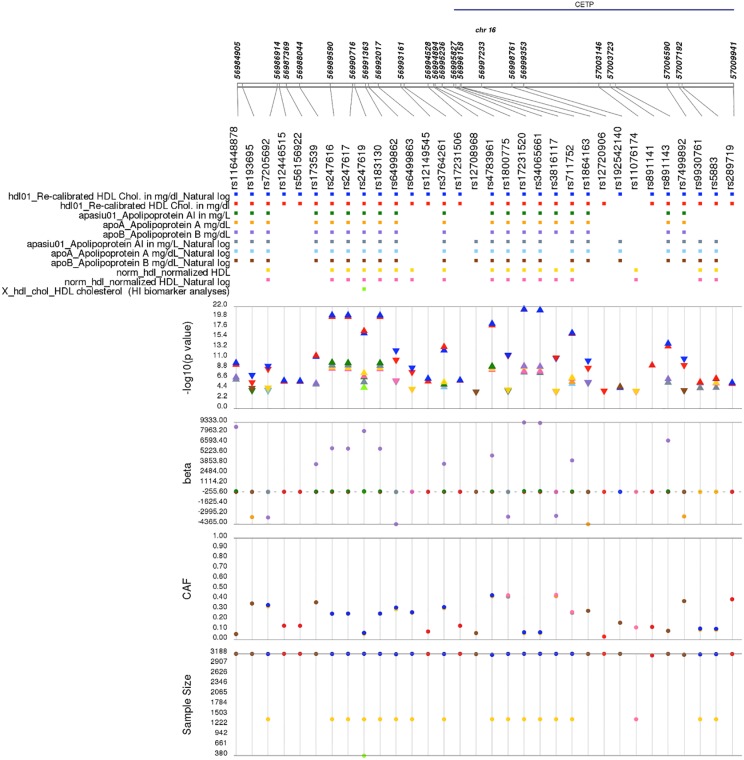
Fig 5. CETP rs3764261 and nearby single nucleotide polymorphisms associated with lipid-related traits in a single Population Architecture using Genomics and Epidemiology (PAGE) study.
Plotted are single SNP tests of association in the Atherosclerosis Risk in Communities (ARIC) for CETP rs3764261 and nearby SNPs within 100kb of previously-reported genome-wide association study (GWAS) associations also associated here at p<1.0x10⁻⁴ with lipid-related traits. Data shown are sample size, coded allele frequency (CAF), genetic effect size (beta), -log10(p-value), and ARIC phenotypes on the y-axes. Each SNP is plotted on the x-axis at the top of the figure from 5´ to 3′, and genomic positions along chromosome 16 along with annotated genes are given above. Data are color-coded by phenotype and displayed as a square (for SNPs), a triangle (p-values), or closed circles (betas, CAFs, and sample size). Direction of the triangle represents the direction of the effect size.

