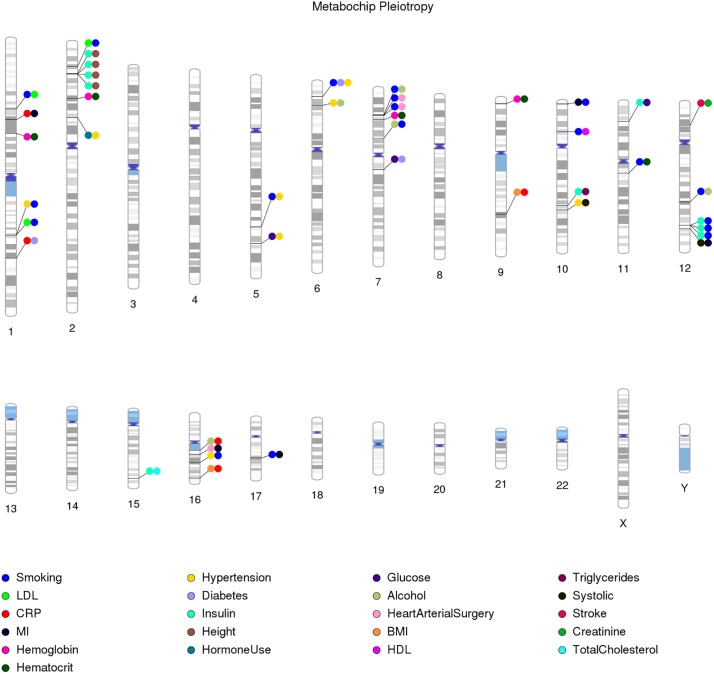
Fig 6. Phenotype classes associated with the same single nucleotide polymorphism in African Americans from the Population Architecture using Genomics and Epidemiology (PAGE) study.
A plot of the 43 PheWAS results where two or more phenotype classes were significantly associated (p<0.01) with the same single nucleotide polymorphism (SNP) in participating PAGE study sites. This plot does not include concomitant lipid phenotype-class results (53 SNPs) or white blood cell related results for chromosome 1 (37 SNPs). Lines connect the SNP chromosomal location to circles, and the color of each circle corresponds to an associated phenotype class listed in the legend at the bottom.

