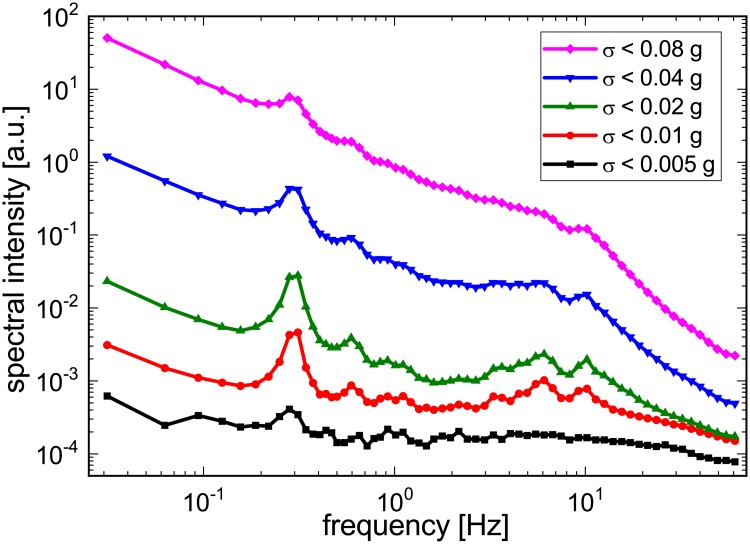
Fig 1. Spectral intensity of wrist acceleration during different levels of motion activity.
Periodograms are shown for five exponentially increasing acceleration variance thresholds (black: smallest threshold; magenta: largest threshold). Peaks related with respiratory motion (at ≈ 0.3 Hz) and pulse waves (at ≈ 6 − 10 Hz) are most clearly visible for intermediate acceleration variance levels (red and green curves) (after [6]).

