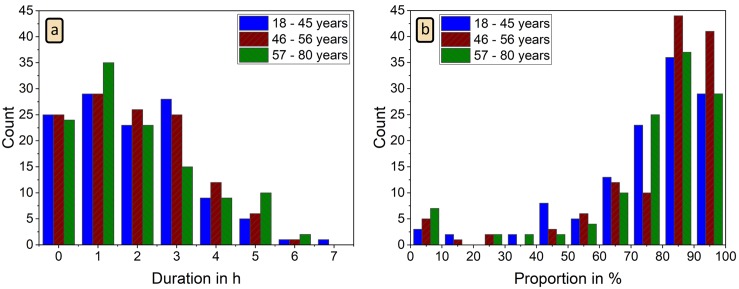
Fig 7. Histograms for total PWI duration and correctness of PWI identification.
(a) Histogram of total duration of all detected PWI for each night; (b) histogram of fraction of correctly reconstructed and associated PWI (as compared to RRI from ECG) for each night. No clear differences between the three age groups (see Table 3) can be seen.

