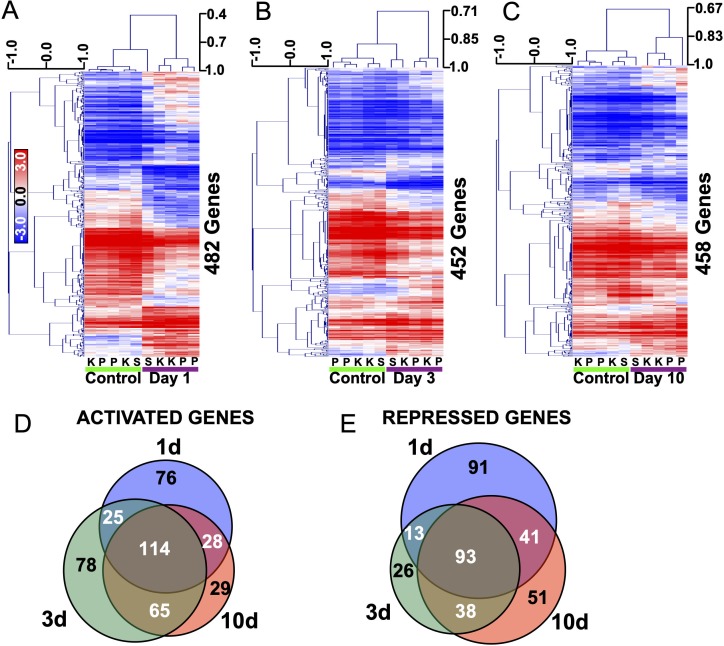
Fig 1. Transcriptome analysis of rat dentate granule cells post SE highlights persistent gene changes in the early latent period.
A-C) Heat maps of genes differentially expressed by more than 2 Standard Deviations of the mean change and FDR<5% at 1,3, or 10d after SE induced by systemic Kainate (k), Pilocarpine (p) or Self-Sustaining Status Epilepticus (s). Scale: Pearson correlation coefficient. D) Venn diagram showing overlap between genes up-regulated 1d, 3d and 10d post SE. E) Venn diagram showing overlap between genes down-regulated 1d, 3d and 10d post SE.

